Fig. 6
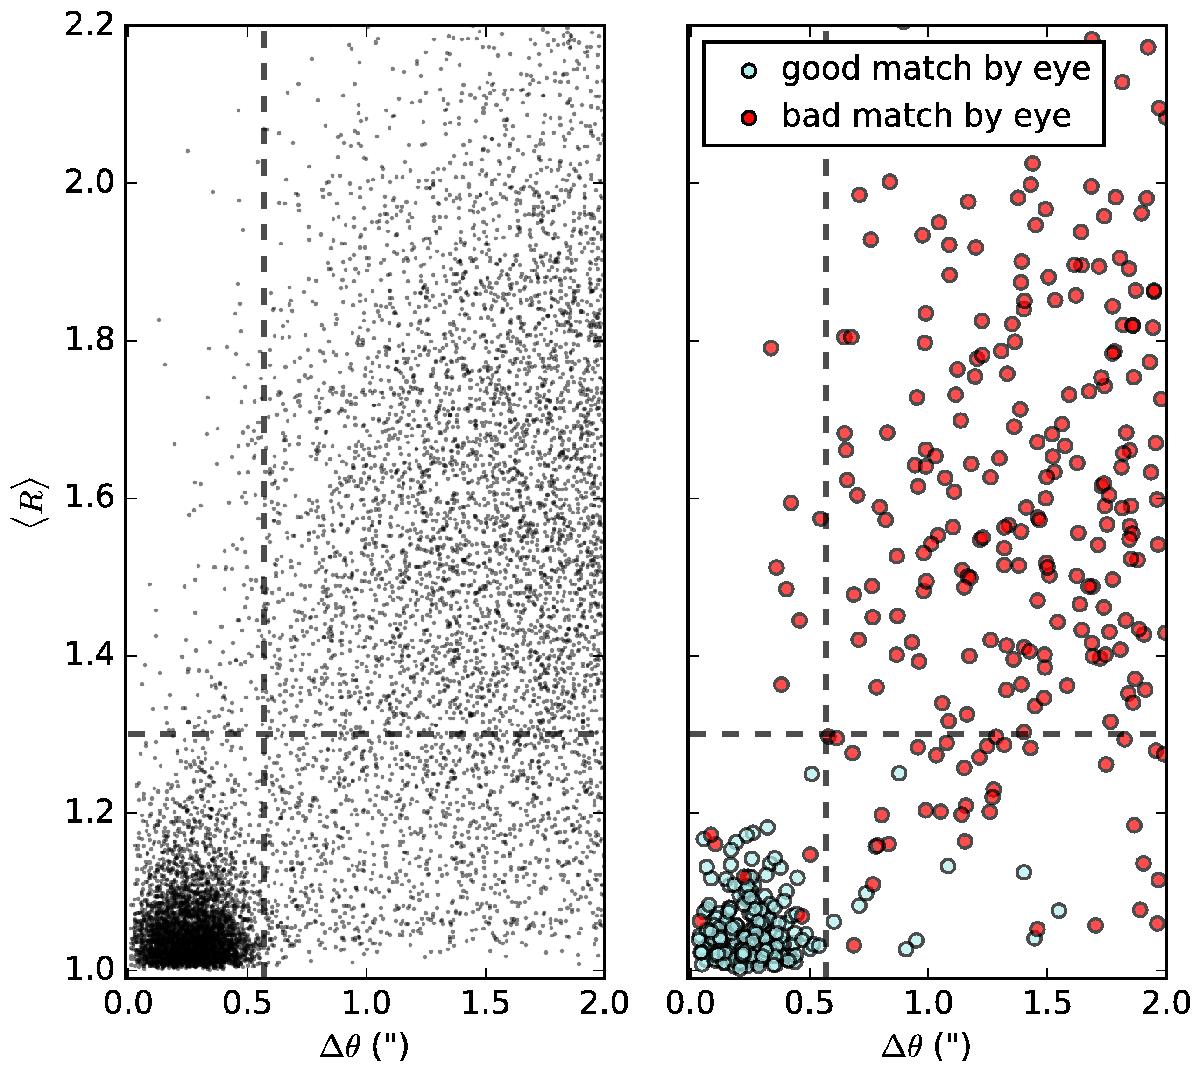
Mean spline to quadratic function ratio ⟨ R ⟩ (as defined in Eq. (1)) vs. the angular distance Δθ from the associated R08 object, for all unambiguous UKIDSS sources detected (left panel), and for the sources from the validation sample (right panel), which are color-coded according to their visual evaluation of good (pale sky blue) or bad (red) match with the MIR SED. The limits on ⟨ R ⟩ and Δθ defining the quantitative criteria of Eq. (2) are indicated as dashed lines on both panels.
Current usage metrics show cumulative count of Article Views (full-text article views including HTML views, PDF and ePub downloads, according to the available data) and Abstracts Views on Vision4Press platform.
Data correspond to usage on the plateform after 2015. The current usage metrics is available 48-96 hours after online publication and is updated daily on week days.
Initial download of the metrics may take a while.