Fig. 5
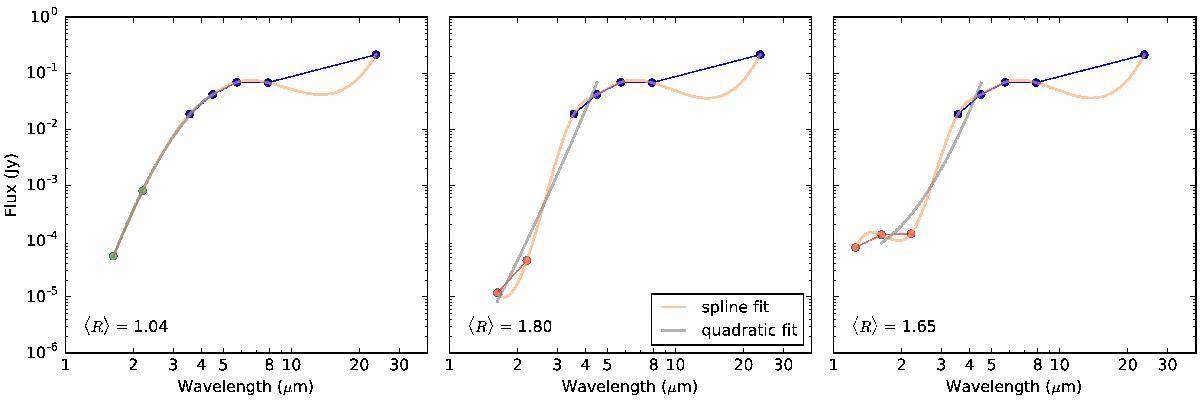
Example of the method implemented in this work to evaluate the smoothness of the NIR-MIR transition of the SED constructed for every UKIDSS source and the corresponding R08 object. For each one of the three UKIDSS sources detected for the R08 object SSTGLMC G048.9610−00.3963 (the same shown in Fig. 4), we plot the combined NIR-MIR SED overlaid with its cubic spline representation (yellow line) and the quadratic function fitted over the 4 middle points (H, K, 3.6 μm, and 4.5 μm filters; gray line). The value for the mean ratio of both curves as defined in Eq. (1) is indicated at the lower left corner of each panel. Colors for the SED points are as in the right panel of Fig. 4. In this particular example, the J upper limits have been simply ignored by the method (see the text for details on how different cases like this are treated).
Current usage metrics show cumulative count of Article Views (full-text article views including HTML views, PDF and ePub downloads, according to the available data) and Abstracts Views on Vision4Press platform.
Data correspond to usage on the plateform after 2015. The current usage metrics is available 48-96 hours after online publication and is updated daily on week days.
Initial download of the metrics may take a while.