Fig. 4
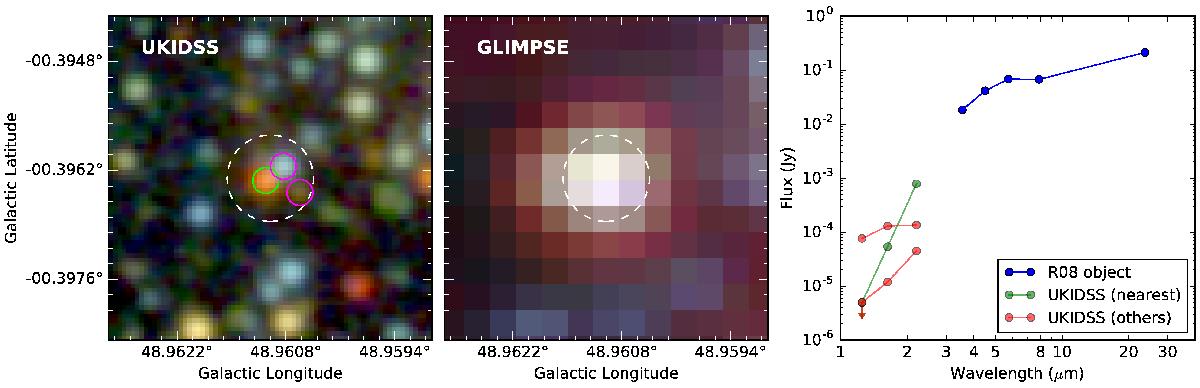
Illustration of the usefulness of the SEDs comparison to identify dominant UKIDSS sources. This example shows the R08 object SSTGLMC G048.9610−00.3963 and the three detected UKIDSS sources within a radius of 2′′, which is indicated by the dashed-line circle. Left: UKIDSS JHK three-color image overlaid with the positions of the UKIDSS sources as open circles (green for the nearest in angular separation, and magenta for the others). Middle: GLIMPSE 3.6, 4.5, and 8.0 μm three-color image of the same field. Right: SED of the R08 object at 3.6, 4.5, 5.8, 8.0, and 24 μm wavelengths (blue points), plotted together with the SEDs of the three UKIDSS sources in the J, H, and K bands (green points for the nearest source and red points for the others).
Current usage metrics show cumulative count of Article Views (full-text article views including HTML views, PDF and ePub downloads, according to the available data) and Abstracts Views on Vision4Press platform.
Data correspond to usage on the plateform after 2015. The current usage metrics is available 48-96 hours after online publication and is updated daily on week days.
Initial download of the metrics may take a while.