Fig. 3
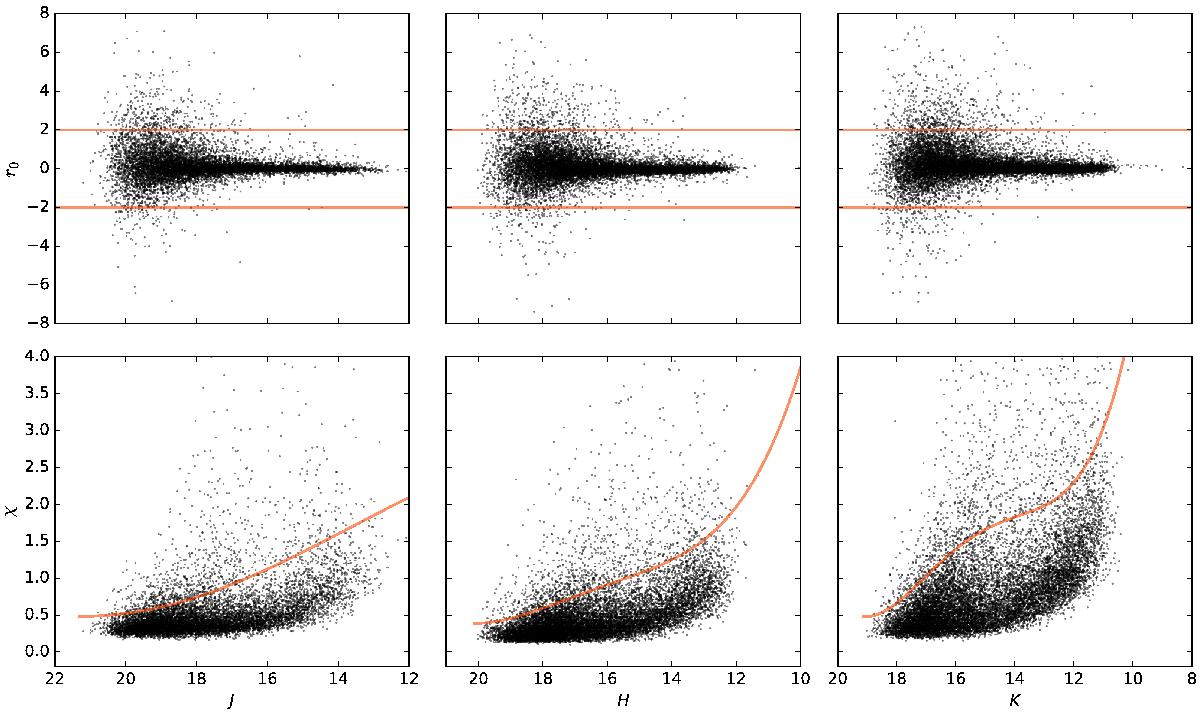
DAOPHOT quality indices r0 and χ as a function of the magnitude for all sources detected within 2′′ of non-saturated R08 objects, in each UKIDSS band. The different lines show the thresholds defining the bad-quality flag in a particular filter: | r0 | = 2 in the top panels, and the curve χlim(m) in the bottom panels (derived empirically as described in the text). A source was considered as having bad-quality photometry in a given band if | r0 | > 2 or χ > χlim(m).
Current usage metrics show cumulative count of Article Views (full-text article views including HTML views, PDF and ePub downloads, according to the available data) and Abstracts Views on Vision4Press platform.
Data correspond to usage on the plateform after 2015. The current usage metrics is available 48-96 hours after online publication and is updated daily on week days.
Initial download of the metrics may take a while.