Fig. A.1
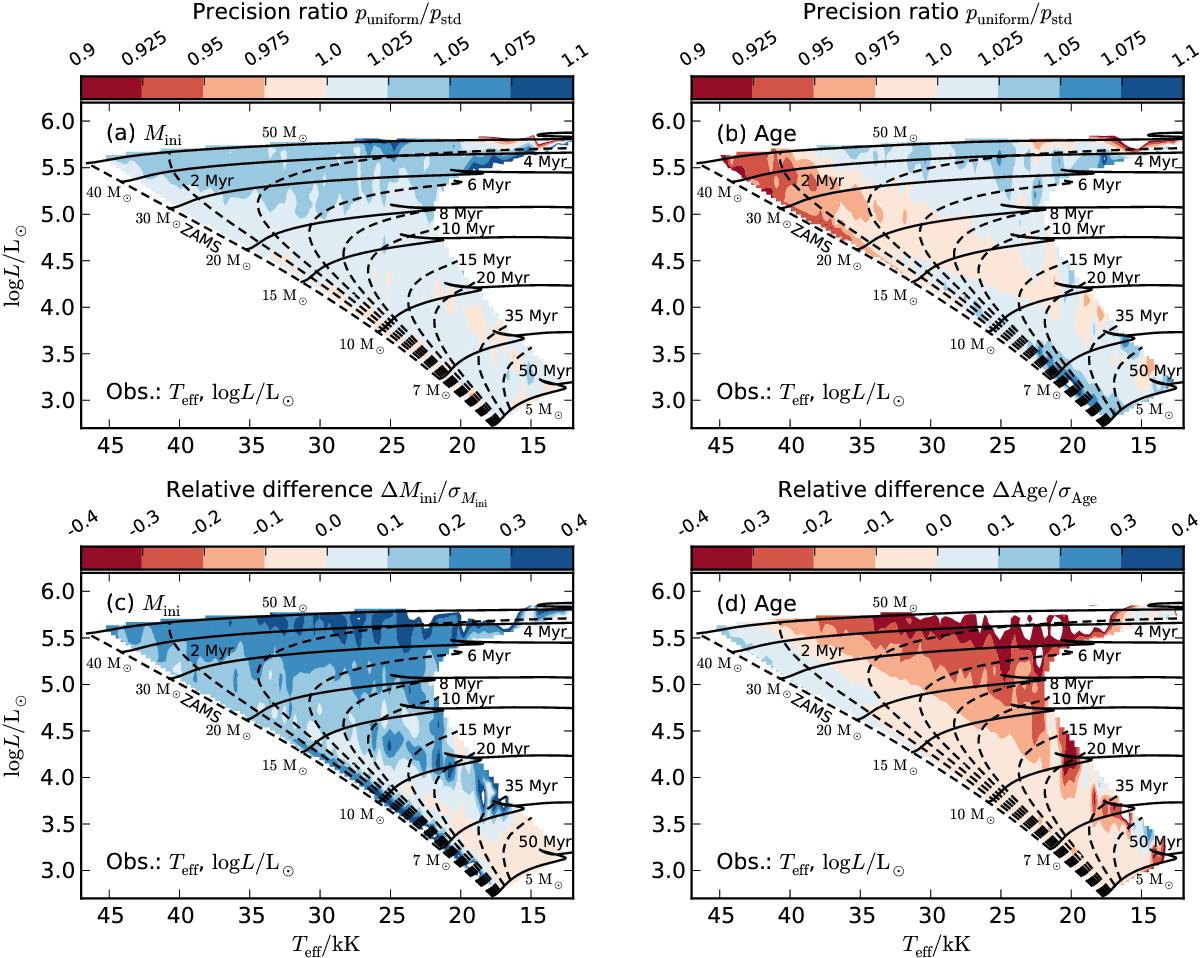
Changes in the precisions p = σx/x (top row) and most likely values (bottom row) of initial mass (left column) and age (right column) when assuming a uniform Mini-prior instead of the Salpeter IMF prior distribution applied in our default statistical model (the changes in most likely values are defined analogously to those in Fig. 8, i.e. Δx = xuniform−xstd; xuniform and xstd, and puniform and pstd denote the most likely values and precisions for a uniform Mini-prior distribution and our standard prior choice, respectively). The observables are effective temperature and luminosity, and the precision ratios and relative differences are with respect to the precisions and most likely values when neglecting correlations (cf. Figs. 5, 8a, and b). For more details, see Sect. A.
Current usage metrics show cumulative count of Article Views (full-text article views including HTML views, PDF and ePub downloads, according to the available data) and Abstracts Views on Vision4Press platform.
Data correspond to usage on the plateform after 2015. The current usage metrics is available 48-96 hours after online publication and is updated daily on week days.
Initial download of the metrics may take a while.