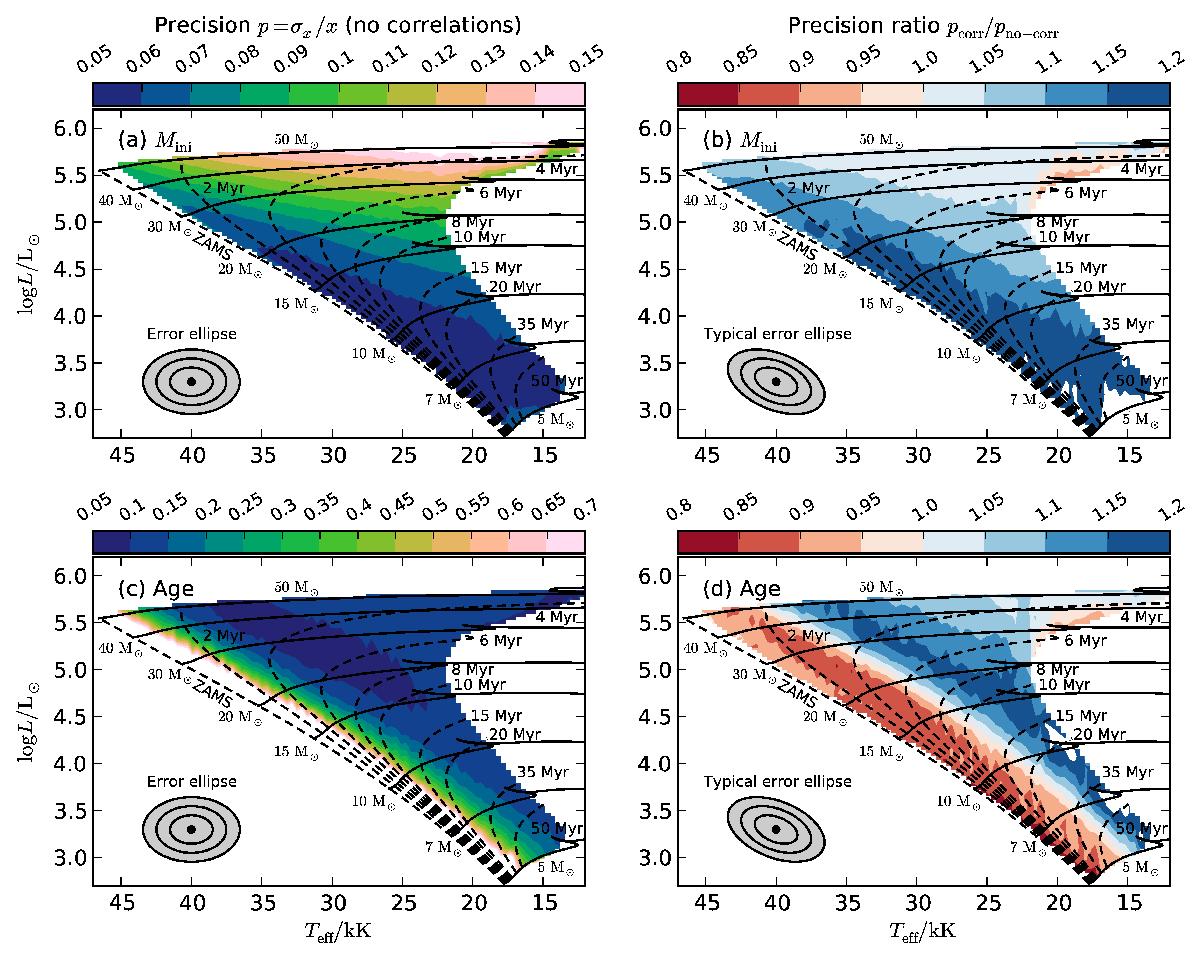
Fig. 5

Precisions p = σx/x (left panels) and precision ratios pcorr/pno−corr (right panels) of determined initial masses (upper panels) and ages (lower panels) of our mock stars in the HR diagram (here, σx and x are the 1σ error bars and most likely values of initial mass and age, respectively, and pcorr and pno−corr denote the precisions when considering and neglecting correlations, respectively). The colour-coding in the left panelsa) and c) show the precision neglecting correlations and the colours in the right panelsb) and d) the ratio of the precisions taking correlations into account. The 1σ uncertainties of the mock stars are 1000 K in effective temperature and 0.1 dex in luminosity, and the resulting 1σ, 2σ, and 3σ contours of the likelihood function are shown in the lower left corners (a correlation parameter of 4 × 10⁻⁵ K-1 is used for illustration purposes in panels b) and d). The plotted stellar tracks and isochrones are Milky Way metallicity, non-rotating models from Brott et al. (2011).
Current usage metrics show cumulative count of Article Views (full-text article views including HTML views, PDF and ePub downloads, according to the available data) and Abstracts Views on Vision4Press platform.
Data correspond to usage on the plateform after 2015. The current usage metrics is available 48-96 hours after online publication and is updated daily on week days.
Initial download of the metrics may take a while.


