Fig. 4
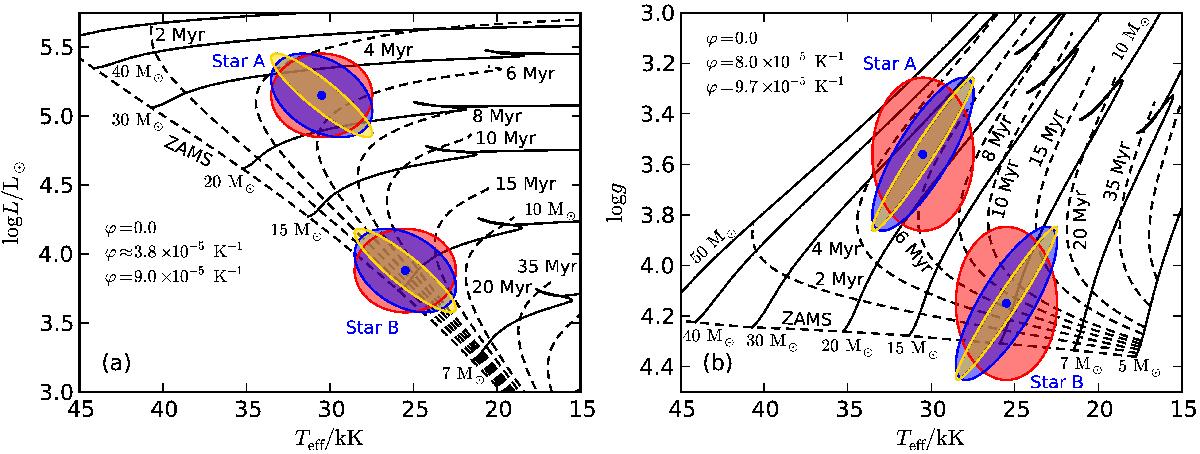
Mock stars, Star A and B, in the HR diagram, panel a), and Kiel diagram, panel b). The error ellipses indicate 1σ confidence regions and we increased our standard error bars by a factor of 2 for illustration purposes. The red ellipses are for the case of uncorrelated observables and the blue ellipses for correlations as described in Sects. 2.3 and 2.4, and applied in Sects. 3.2 and 3.3. For illustration purposes, the golden ellipses show very strong correlations. The solid lines are the non-rotating, Milky Way metallicity stellar tracks of Brott et al. (2011) for masses ranging from 5 to 50 M⊙, and the dashed lines are the corresponding isochrones from 0 to 50 Myr.
Current usage metrics show cumulative count of Article Views (full-text article views including HTML views, PDF and ePub downloads, according to the available data) and Abstracts Views on Vision4Press platform.
Data correspond to usage on the plateform after 2015. The current usage metrics is available 48-96 hours after online publication and is updated daily on week days.
Initial download of the metrics may take a while.