Fig. 2
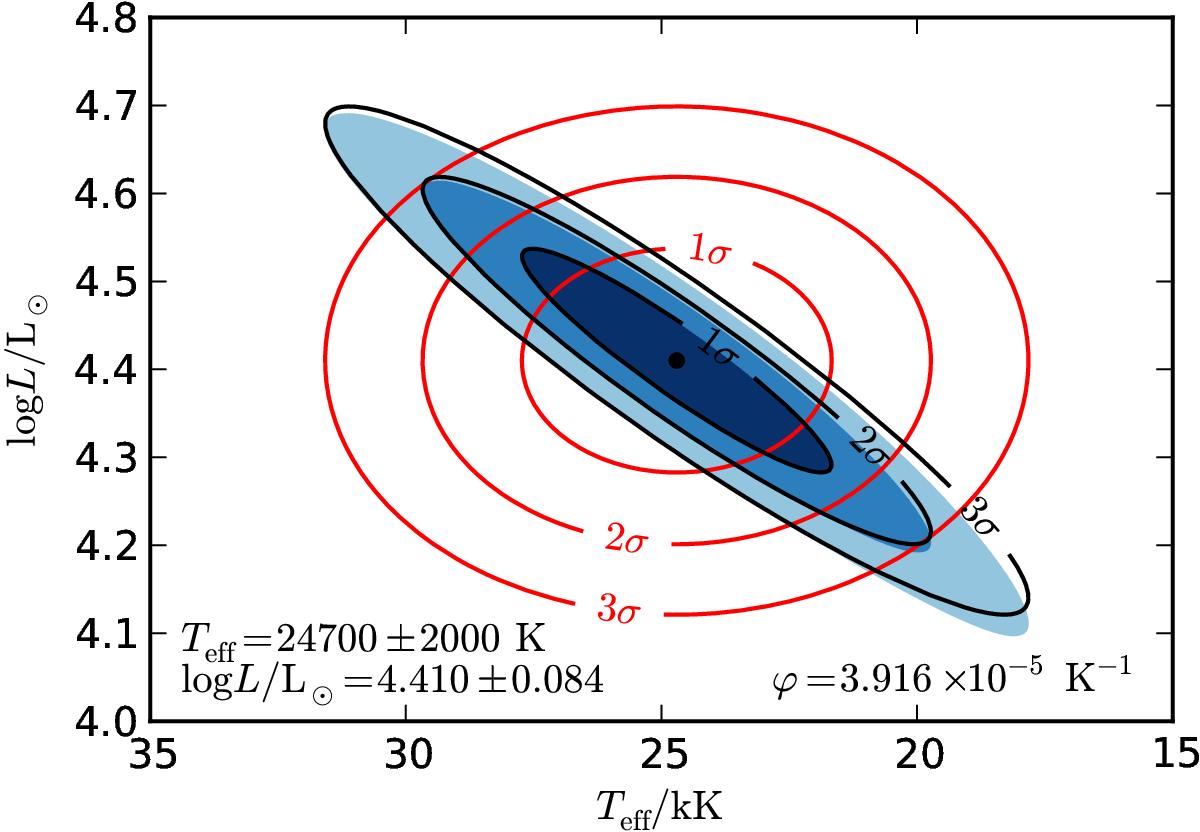
Comparison of the reference likelihood function with two approximations that neglect and account for correlations. The 1σ, 2σ, and 3σ areas of the reference likelihood function in the HR diagram are shown by the shaded areas. The red contours show the same confidence levels of a likelihood model that neglects the correlation in luminosity and effective temperature, and the black contours show our new likelihood model for a correlation parameter of ϕ = 3.916 × 10⁻⁵ K-1. The marginalised observables are Teff = 24 700 ± 2000 K and log L/L⊙ = 4.410 ± 0.084 for all three likelihood models.
Current usage metrics show cumulative count of Article Views (full-text article views including HTML views, PDF and ePub downloads, according to the available data) and Abstracts Views on Vision4Press platform.
Data correspond to usage on the plateform after 2015. The current usage metrics is available 48-96 hours after online publication and is updated daily on week days.
Initial download of the metrics may take a while.