Fig. 1
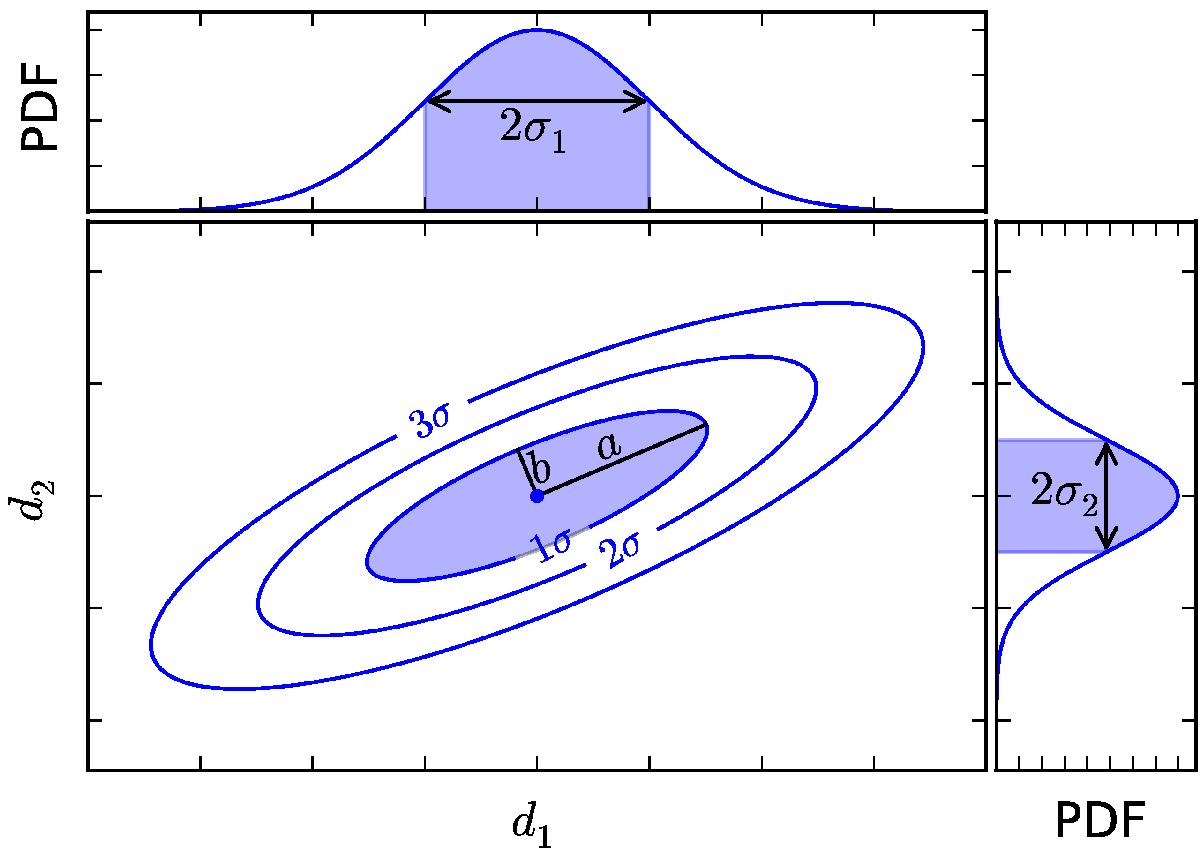
Schematic representation of the 1σ, 2σ, and 3σ contours of a Gaussian likelihood function of two correlated observables d1 and d2. The semi-major and -minor axes a and b of the 1σ contour are indicated. The marginalised probability density functions (PDFs) of the two observables are shown in the top and right panels. They are Gaussian functions with standard deviations σ1 and σ2 (the conventional error bars). In this example, σ1 = 2σ2.
Current usage metrics show cumulative count of Article Views (full-text article views including HTML views, PDF and ePub downloads, according to the available data) and Abstracts Views on Vision4Press platform.
Data correspond to usage on the plateform after 2015. The current usage metrics is available 48-96 hours after online publication and is updated daily on week days.
Initial download of the metrics may take a while.