Free Access
Fig. 9
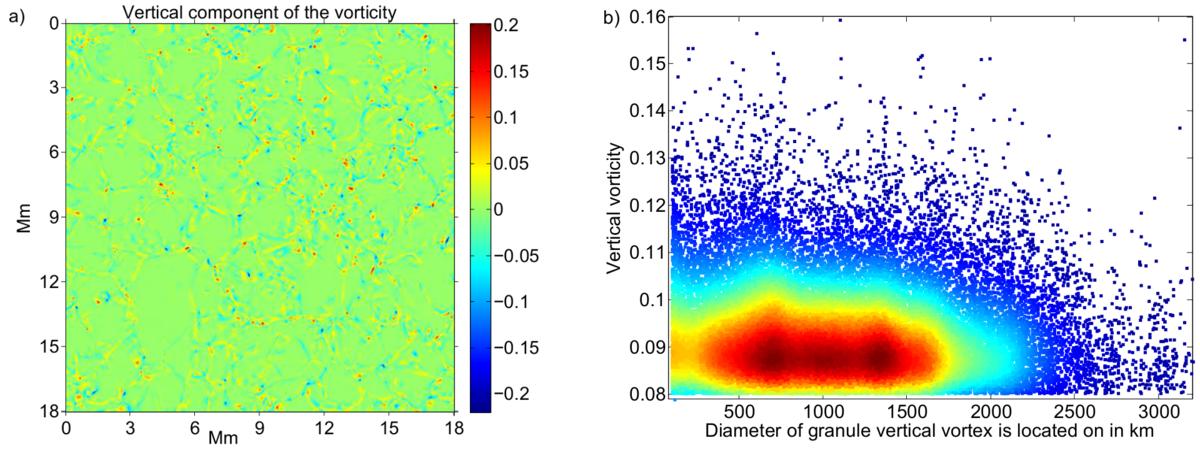
a) Snapshot of the vertical component of the vorticity; strong vortices are colored in red and blue. b) Density scatter plot of the strength of the vertical component of the vorticity vs. the diameter of a granule, which is located at the position of a detected vertical vortex; red indicates a high density.
Current usage metrics show cumulative count of Article Views (full-text article views including HTML views, PDF and ePub downloads, according to the available data) and Abstracts Views on Vision4Press platform.
Data correspond to usage on the plateform after 2015. The current usage metrics is available 48-96 hours after online publication and is updated daily on week days.
Initial download of the metrics may take a while.