Fig. 7
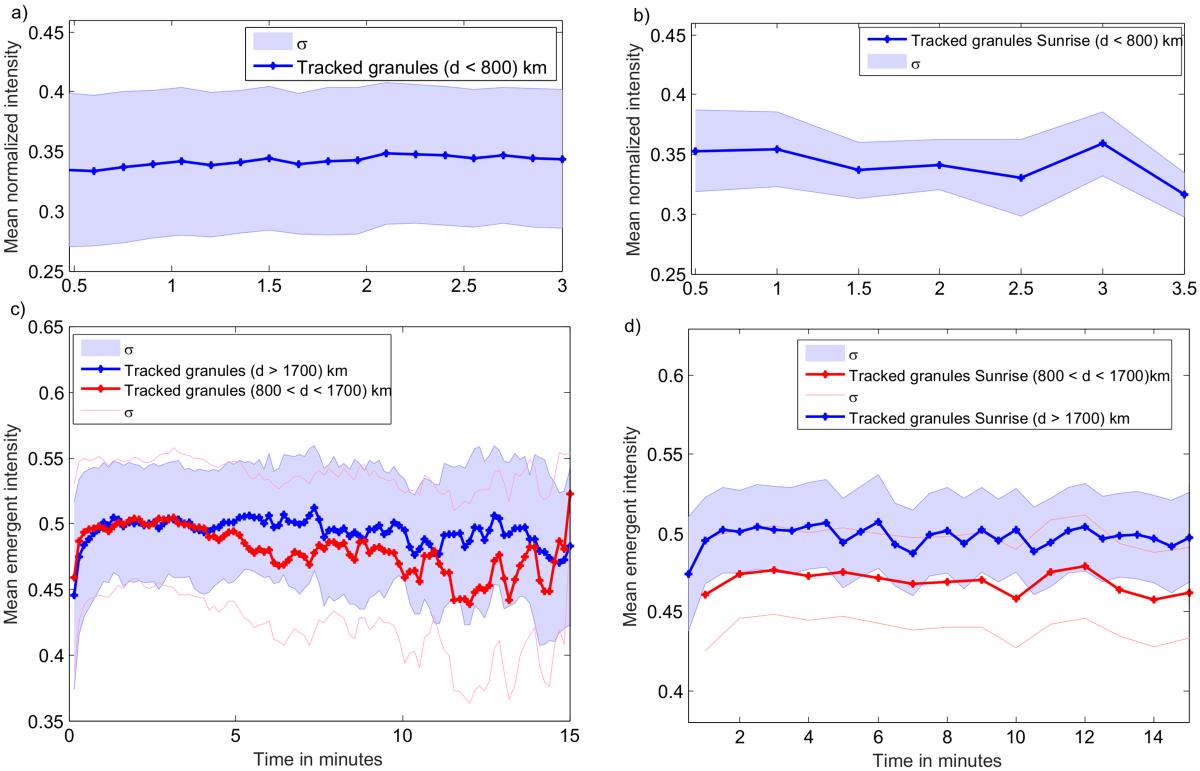
a) Evolution of the emergent intensity of small granules in simulations. b) Evolution of the intensity of small granules tracked in SUNRISE IMaX observations. c) Evolution of the emergent intensity of large (>1700 km; blue line) and medium-sized (800 km < d < 1700 km; red) granules in simulations with time. d) Evolution of the emergent intensity of large (>1700 km; blue line) and medium-sized (800 km < d < 1700 km; red) granules with time in observations. The error bars of the curves represent the standard deviation with a confidence interval of 1-σ.
Current usage metrics show cumulative count of Article Views (full-text article views including HTML views, PDF and ePub downloads, according to the available data) and Abstracts Views on Vision4Press platform.
Data correspond to usage on the plateform after 2015. The current usage metrics is available 48-96 hours after online publication and is updated daily on week days.
Initial download of the metrics may take a while.