Fig. 3
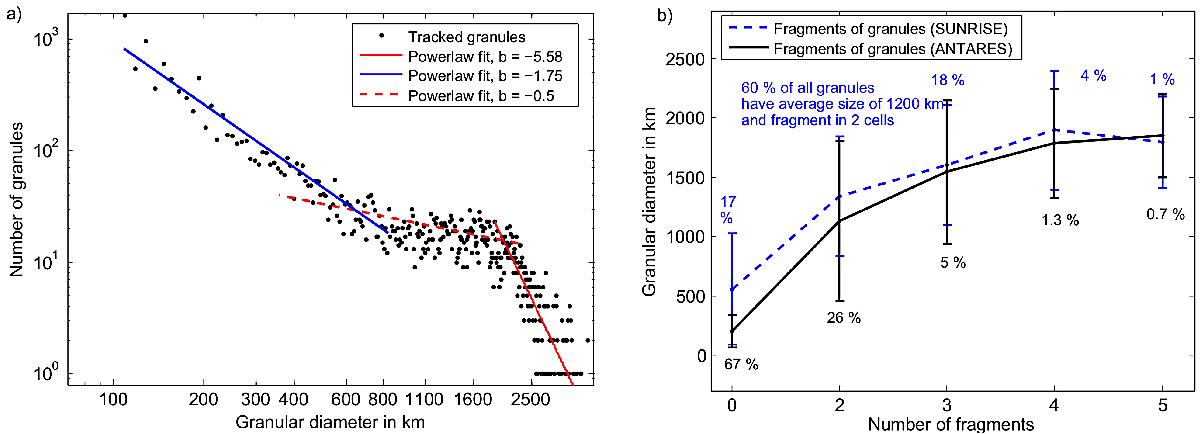
a) Histogram of the diameter of granules in the simulation. The distribution is fitted by power law function with different indices. b) Histogram of the granular diameter vs. the number of fragments including the standard deviation displayed as error bars for granules in simulations (black solid line) and observations (dashed blue line). The percentage of granules that fragment into different cells is stated above and below the error bars.
Current usage metrics show cumulative count of Article Views (full-text article views including HTML views, PDF and ePub downloads, according to the available data) and Abstracts Views on Vision4Press platform.
Data correspond to usage on the plateform after 2015. The current usage metrics is available 48-96 hours after online publication and is updated daily on week days.
Initial download of the metrics may take a while.