Fig. 2
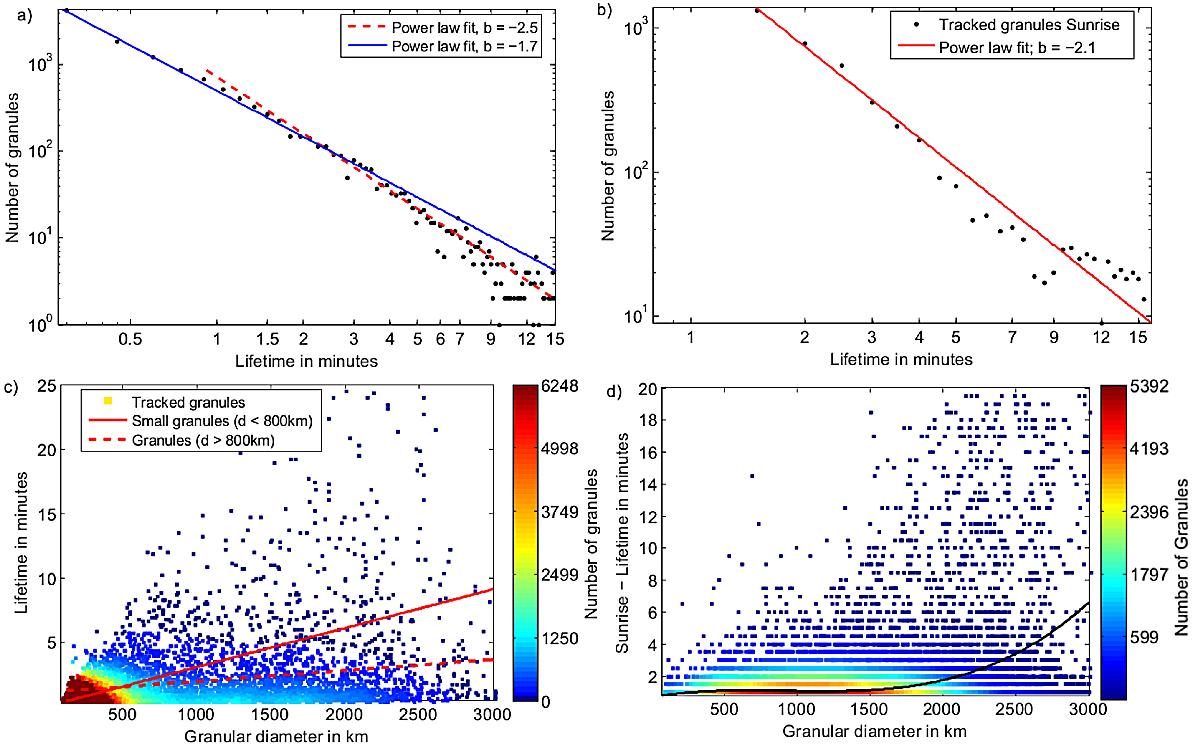
a) Histogram of the lifetime of granules in the RHD simulation. b) Histogram of the lifetime of granules in SUNRISE observations. c) Density scatter plot of granular diameter vs. lifetime of tracked granules in simulations. d) Density scatter plot of granular diameter vs. lifetime of tracked granules in SUNRISE observations; red indicates a high density in tracked granules.
Current usage metrics show cumulative count of Article Views (full-text article views including HTML views, PDF and ePub downloads, according to the available data) and Abstracts Views on Vision4Press platform.
Data correspond to usage on the plateform after 2015. The current usage metrics is available 48-96 hours after online publication and is updated daily on week days.
Initial download of the metrics may take a while.