Free Access
Fig. 11
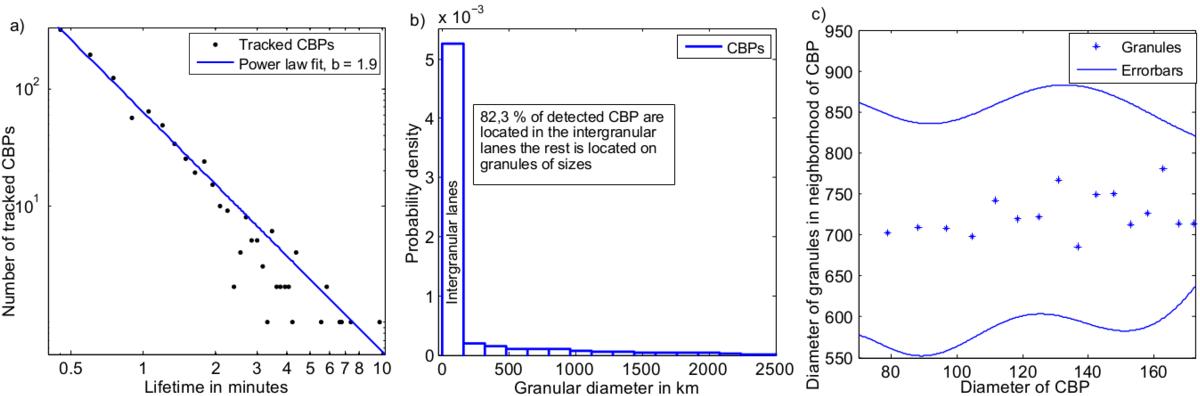
a) Histrogram of lifetimes of CBPs. b) Probability density of detected CBPs located at the position of detected granules of differing size. c) Diameter of CBPs vs. the diameter of neighboring granules including the standard deviation (1-σ).
Current usage metrics show cumulative count of Article Views (full-text article views including HTML views, PDF and ePub downloads, according to the available data) and Abstracts Views on Vision4Press platform.
Data correspond to usage on the plateform after 2015. The current usage metrics is available 48-96 hours after online publication and is updated daily on week days.
Initial download of the metrics may take a while.