Free Access
Fig. 10
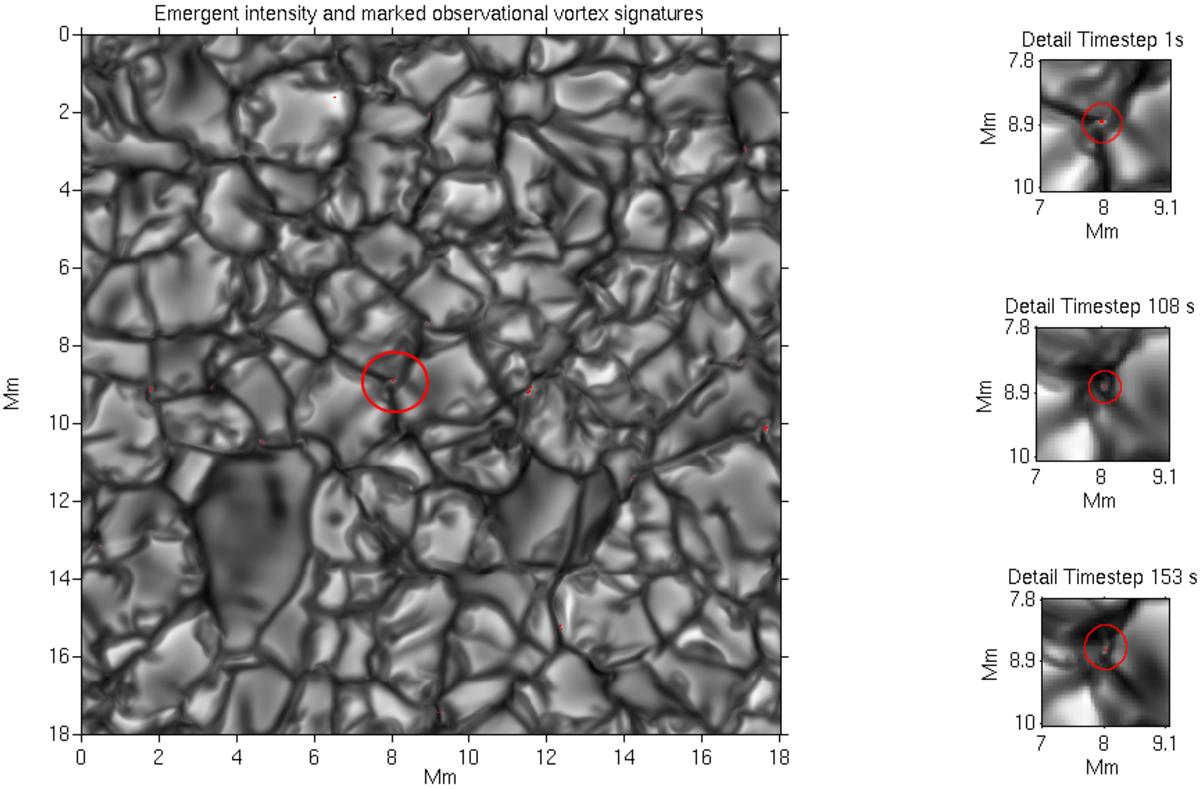
Left panel: emergent intensity snapshot of the simulation run. Detected CBPs are marked in red. Panels at the right: evolution of the detected CBPs, which is encircled in red in the intensity snapshot (left panel).
Current usage metrics show cumulative count of Article Views (full-text article views including HTML views, PDF and ePub downloads, according to the available data) and Abstracts Views on Vision4Press platform.
Data correspond to usage on the plateform after 2015. The current usage metrics is available 48-96 hours after online publication and is updated daily on week days.
Initial download of the metrics may take a while.