Fig. 1
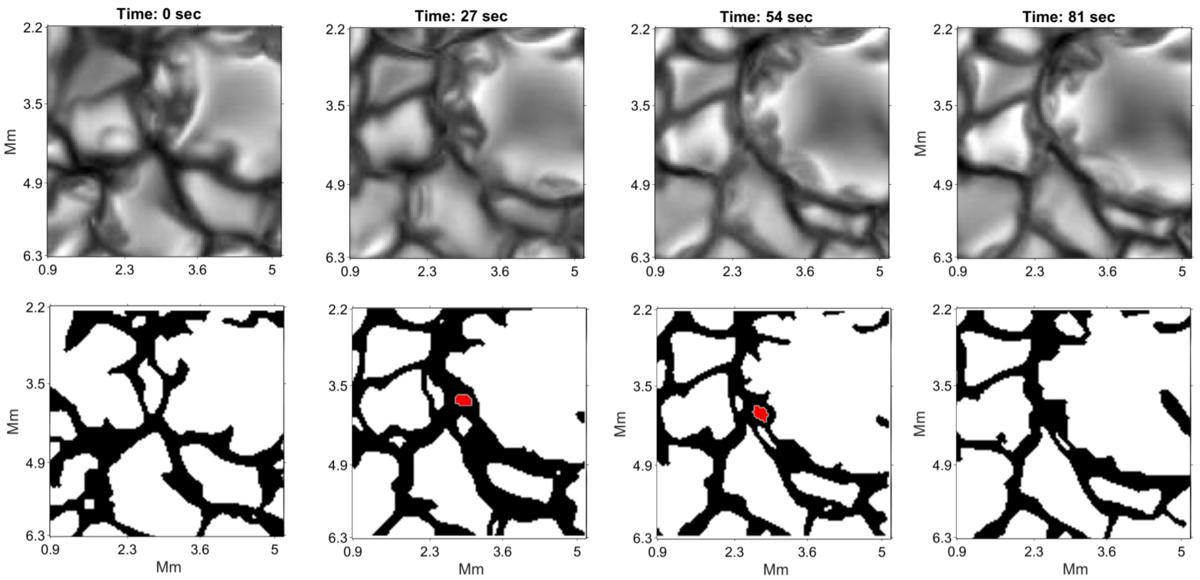
Application of the tracking algorithm applied to segmented profiles from the ANTARES simulation. The first row shows intensity maps of the evolution of a small granule, from its appearance to its dissolution. The second row illustrates the respective segmented intensity maps. The detected small granule is highlighted in red. This example shows that small and faint cells are detected, which is one of the advantages of the segmentation algorithm and the use of the vertical velocity in addition to intensity maps.
Current usage metrics show cumulative count of Article Views (full-text article views including HTML views, PDF and ePub downloads, according to the available data) and Abstracts Views on Vision4Press platform.
Data correspond to usage on the plateform after 2015. The current usage metrics is available 48-96 hours after online publication and is updated daily on week days.
Initial download of the metrics may take a while.