Free Access
Fig. 3
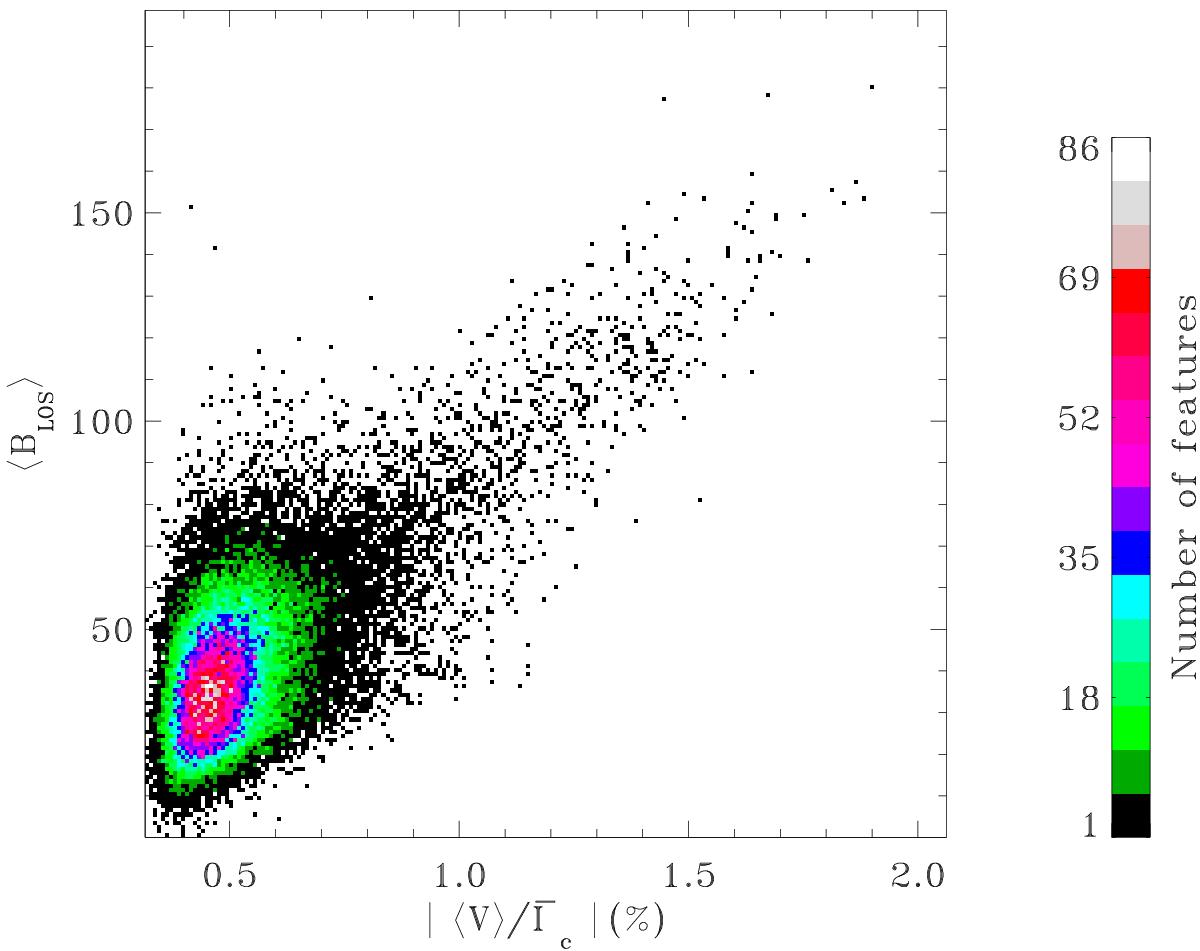
Magnetic flux computed using the COG technique. A 2D histogram of the number of features on the plane spanned by the magnetic feature averaged LOS component of the field ≲ BLOS ⟩ and the feature averaged unsigned Stokes V normalized to the continuum intensity namely, ![]() .
.
Current usage metrics show cumulative count of Article Views (full-text article views including HTML views, PDF and ePub downloads, according to the available data) and Abstracts Views on Vision4Press platform.
Data correspond to usage on the plateform after 2015. The current usage metrics is available 48-96 hours after online publication and is updated daily on week days.
Initial download of the metrics may take a while.