Fig. 12
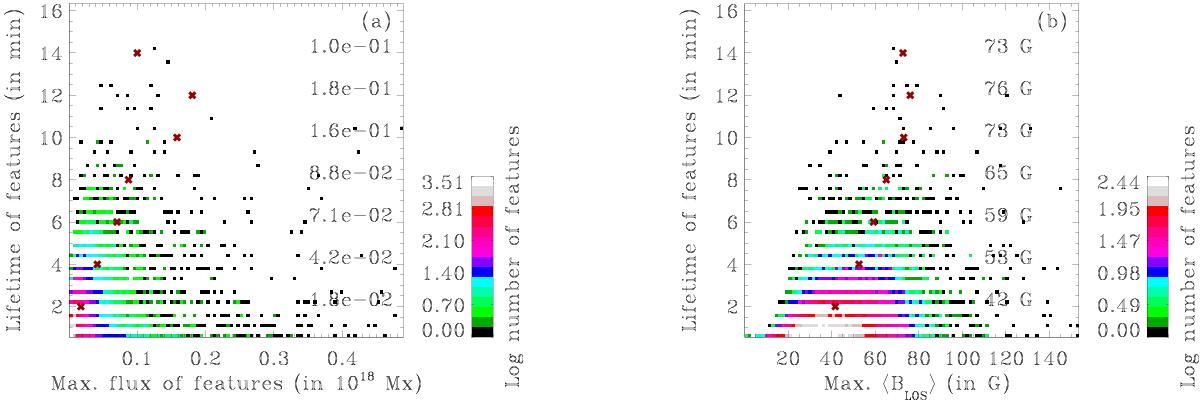
Lifetimes of features for an area ratio criterion 5:1 vs. maximum fluxes (panel a)) and maximum, average magnetic field strength values from COG technique (panel b)). Here maximum refers to the maximum value of the magnetic flux or the field strength, gained during the entire lifetime of the feature. In panel a) the range of plotted maximum flux of feature is limited to 5 × 10¹⁷ Mx to enhance the visibility of flux-lifetime relationship. The over-plotted red cross symbols represent the average value of the maximum flux of features at each lifetime (see main text for details). The maximum ≲ BLOS ⟩ averaged over each lifetime bin are displayed in the figure and are represented by over-plotted red cross symbols.
Current usage metrics show cumulative count of Article Views (full-text article views including HTML views, PDF and ePub downloads, according to the available data) and Abstracts Views on Vision4Press platform.
Data correspond to usage on the plateform after 2015. The current usage metrics is available 48-96 hours after online publication and is updated daily on week days.
Initial download of the metrics may take a while.