Fig. 11
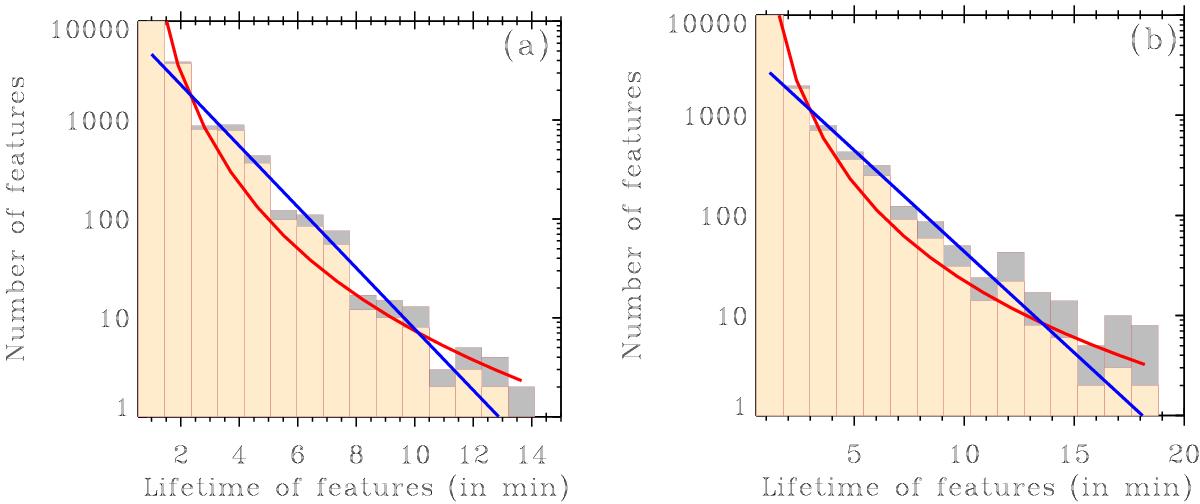
Histograms of lifetimes of the magnetic features for the area-ratio criterion 10:1 (panel a)) and 2:1 (panel b)). The red and the blue lines represent the power-law and the exponential fits respectively. The gray shaded histograms represent the lifetimes with a correction factor (see Sect. 4.5) and the yellow shaded histograms represent the lifetimes without any correction.
Current usage metrics show cumulative count of Article Views (full-text article views including HTML views, PDF and ePub downloads, according to the available data) and Abstracts Views on Vision4Press platform.
Data correspond to usage on the plateform after 2015. The current usage metrics is available 48-96 hours after online publication and is updated daily on week days.
Initial download of the metrics may take a while.