Fig. 7
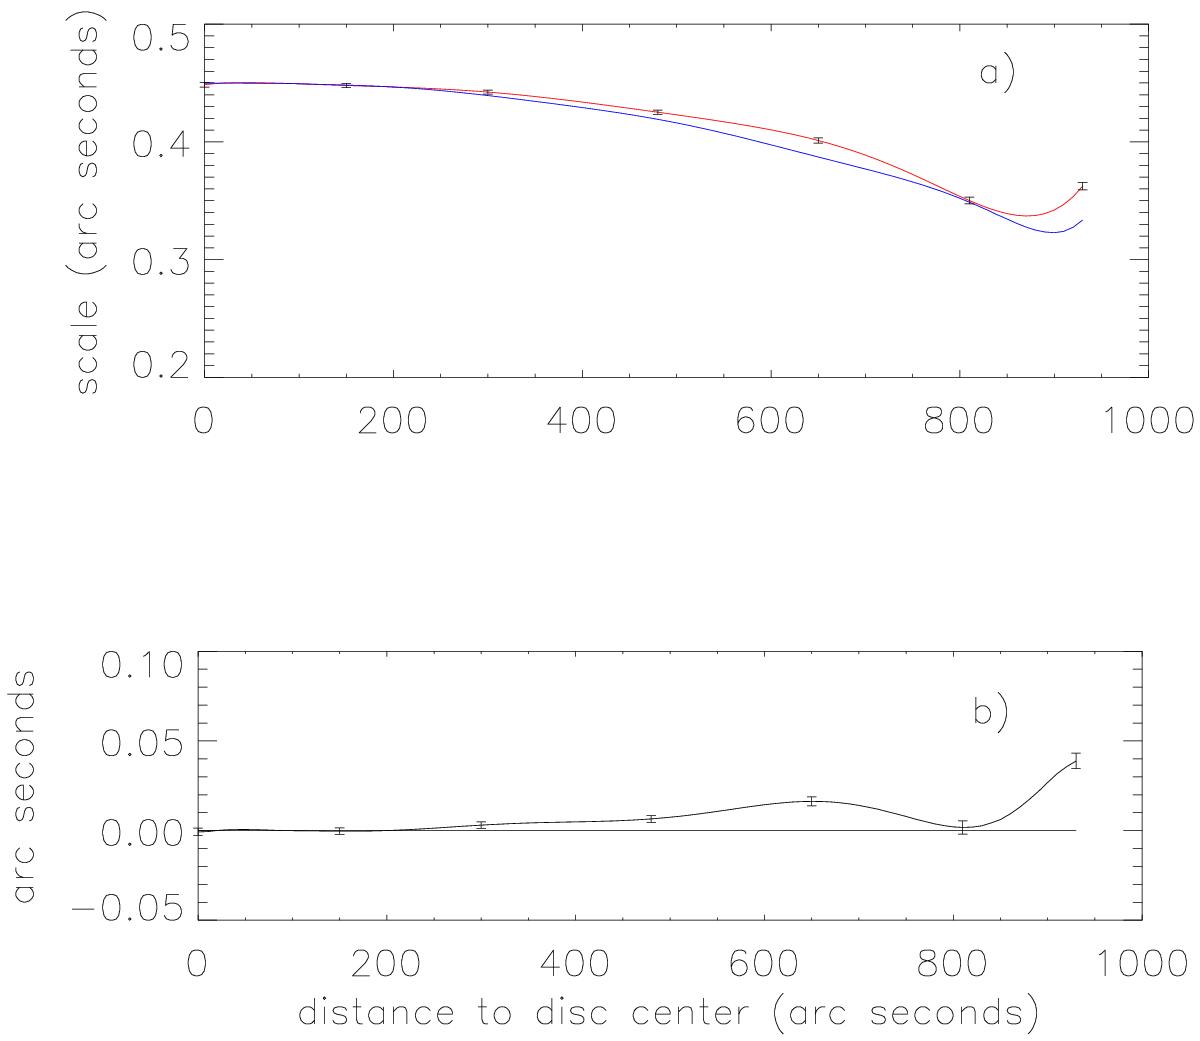
Panel a): comparison of the granulation scale variation along the central meridian averaged between the northern and southern hemispheres (red line), with the variation along the equator, averaged between the eastern and western hemispheres (blue line). Panel b): difference between the N-S and E-W averages relative to the granulation scale at the same distance from the disk center; the error bars are derived from the dispersion of the individual values (see Sect. 4).
Current usage metrics show cumulative count of Article Views (full-text article views including HTML views, PDF and ePub downloads, according to the available data) and Abstracts Views on Vision4Press platform.
Data correspond to usage on the plateform after 2015. The current usage metrics is available 48-96 hours after online publication and is updated daily on week days.
Initial download of the metrics may take a while.