Fig. 4
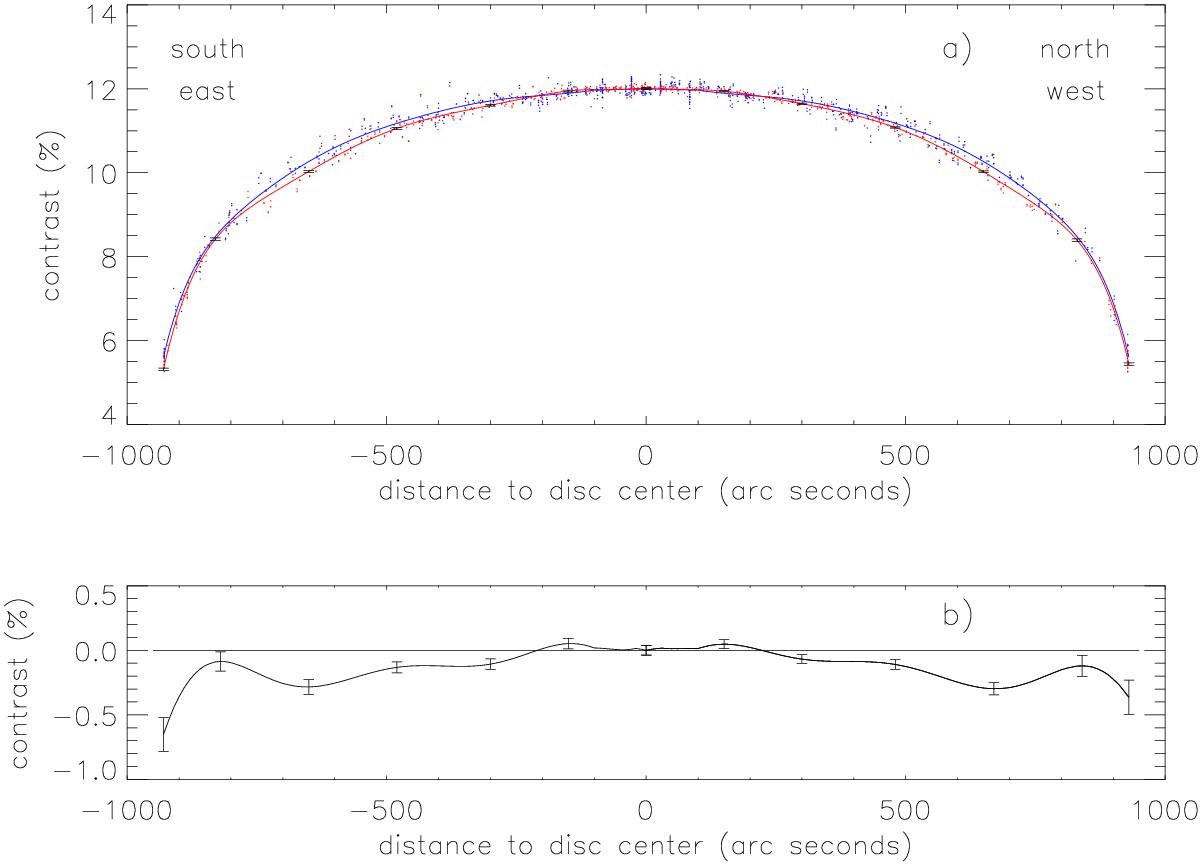
Panel a): comparison of the N-S (red) and E-W (blue) variations of the granulation contrast: individual selected images (dots); 8th order polynomial fits, computed separately in the N, S, E and W hemispheres (full lines). The error bars are weighted standard deviations of the individual values with respect to the polynomial fits, computed along the polynomials. They are only plotted in a few positions on the N-S polynomials, but they are as short on the E-W polynomials. The error bars are very short, because a large number of individual values are involved in the computation and their dispersion is rather small. Panel b): difference between the N-S and E-W variations, relative to the granulation contrast at the same distance from the disk center. The errors along the difference between the N-S and E-W polynomials are the sum of the N-S and E-W errors.
Current usage metrics show cumulative count of Article Views (full-text article views including HTML views, PDF and ePub downloads, according to the available data) and Abstracts Views on Vision4Press platform.
Data correspond to usage on the plateform after 2015. The current usage metrics is available 48-96 hours after online publication and is updated daily on week days.
Initial download of the metrics may take a while.