Fig. 3
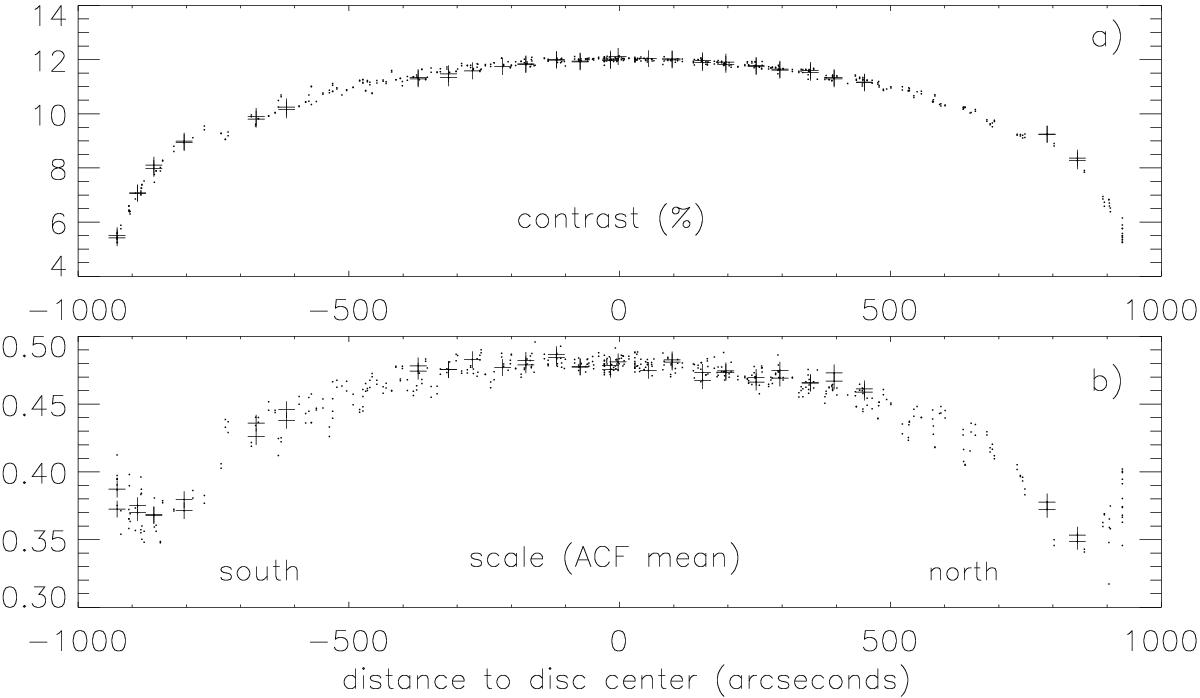
Variation of the granulation contrast (panel a)) and scale (panel b)) of the selected images in the N-S scan of December 21, 2009 (+), compared to the variations of all the selected images in the 12 N-S scans made in 2009. The blurred images at positions –543″, –444″, +523″, +623″ in Fig. 2 are removed. Here, the selected images are divided in two subfields 1024 × 512 pixels (112″ × 56″), in the direction parallel to the polar limbs, in order to increase the scan resolution. Moreover two subfields extracted from the images containing the southern limb are added, one of size 1024 × 512 pixels at the position –890″, the other one, of smaller size, 1024 × 384 pixels, centered at the position –928″; the outer boundary of this subfield is at 10″ from the limb (no subfields have been added close to the northern limb, because the corresponding images are slightly blurred).
Current usage metrics show cumulative count of Article Views (full-text article views including HTML views, PDF and ePub downloads, according to the available data) and Abstracts Views on Vision4Press platform.
Data correspond to usage on the plateform after 2015. The current usage metrics is available 48-96 hours after online publication and is updated daily on week days.
Initial download of the metrics may take a while.