Fig. 6
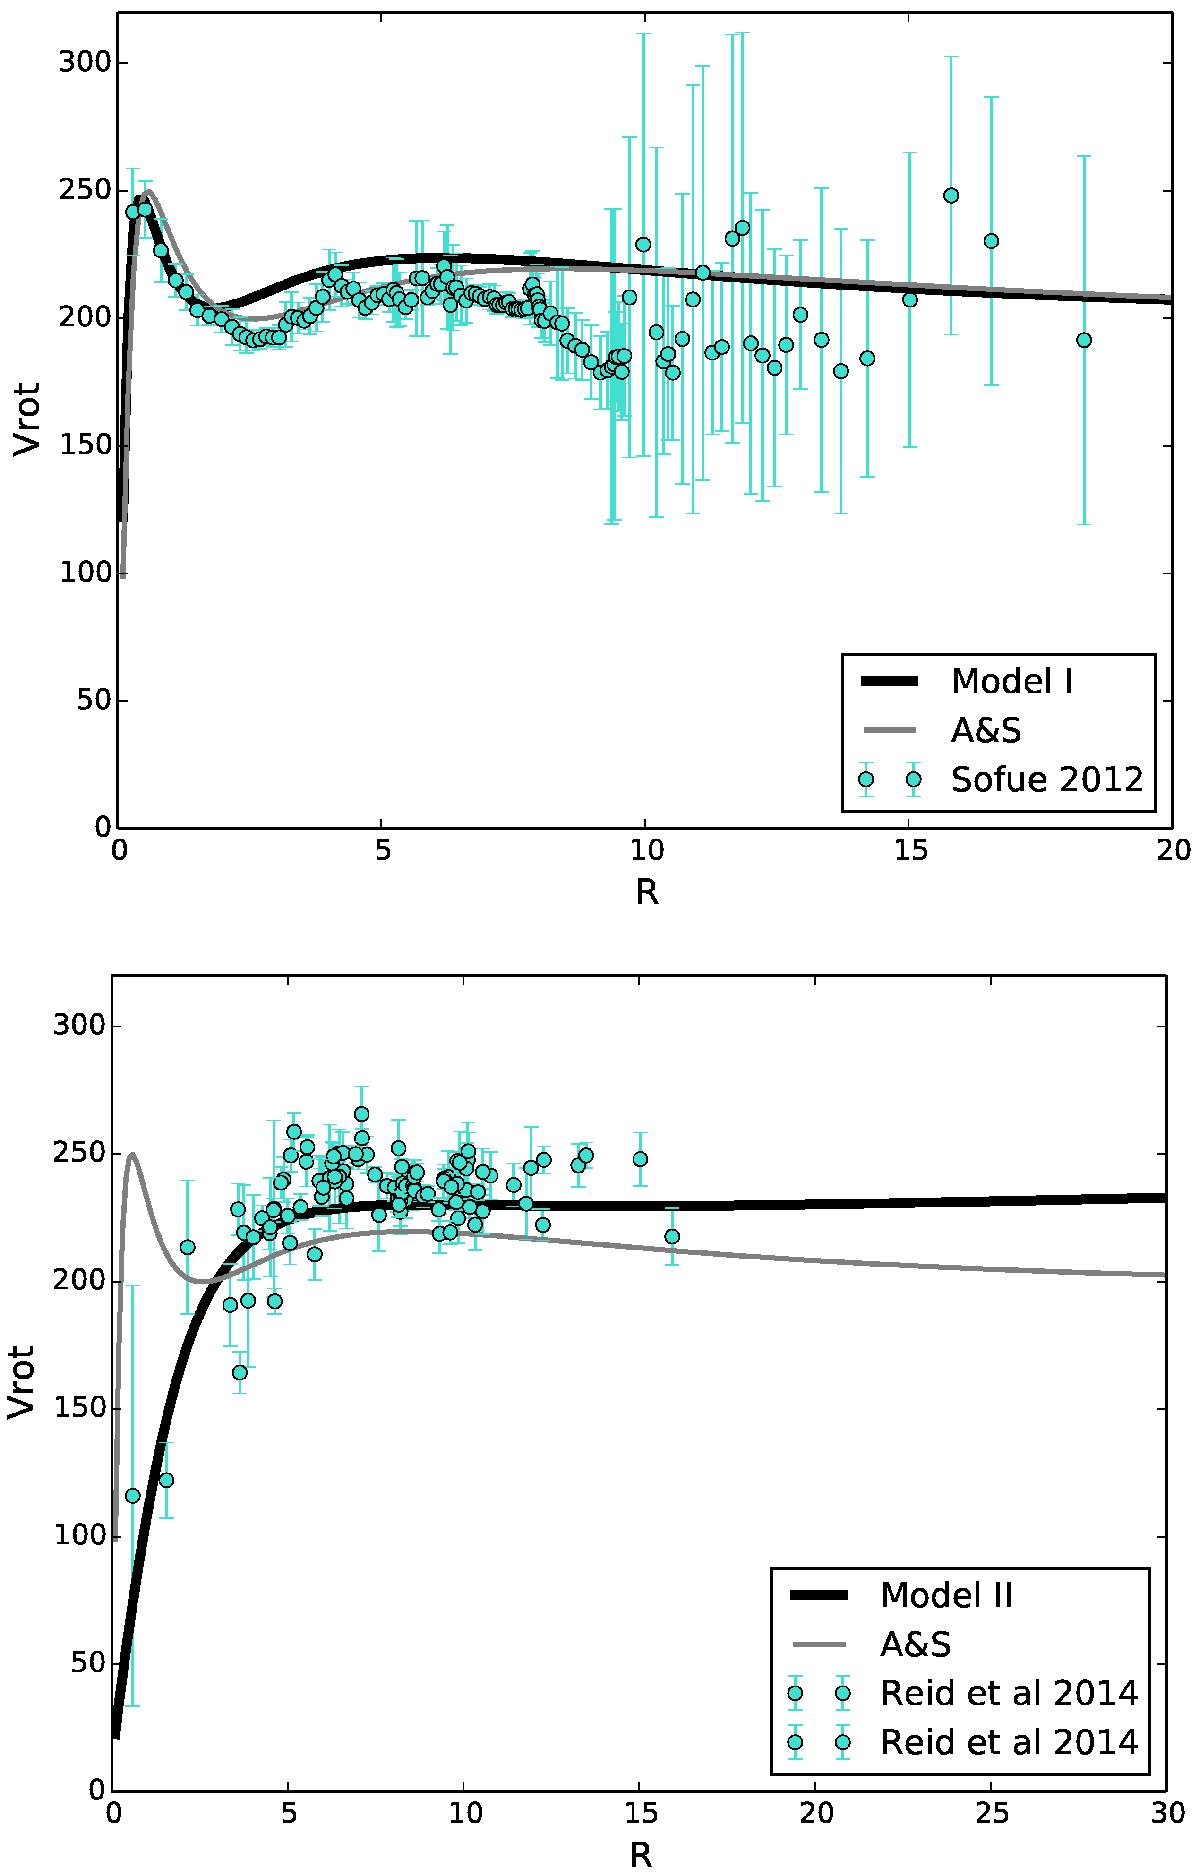
Upper panel: total rotation curve of Model I in the inner 20 kpc (black curve) compared to the CO/HI data by Sofue (2012; cyan points). For comparison, the rotation curve predicted by the Allen & Santillan (1991) model is also shown (grey curve). Lower panel: total rotation curve of Model II (black curve), compared to the Galactic rotation curve obtained with VLBI observations of maser sources by Reid et al. (2014; cyan points). The Allen & Santillan (1991) rotation curve is shown for comparison (grey curve). Models I and II are well bracketed by the two observed rotation curves.
Current usage metrics show cumulative count of Article Views (full-text article views including HTML views, PDF and ePub downloads, according to the available data) and Abstracts Views on Vision4Press platform.
Data correspond to usage on the plateform after 2015. The current usage metrics is available 48-96 hours after online publication and is updated daily on week days.
Initial download of the metrics may take a while.