Free Access
Fig. 5
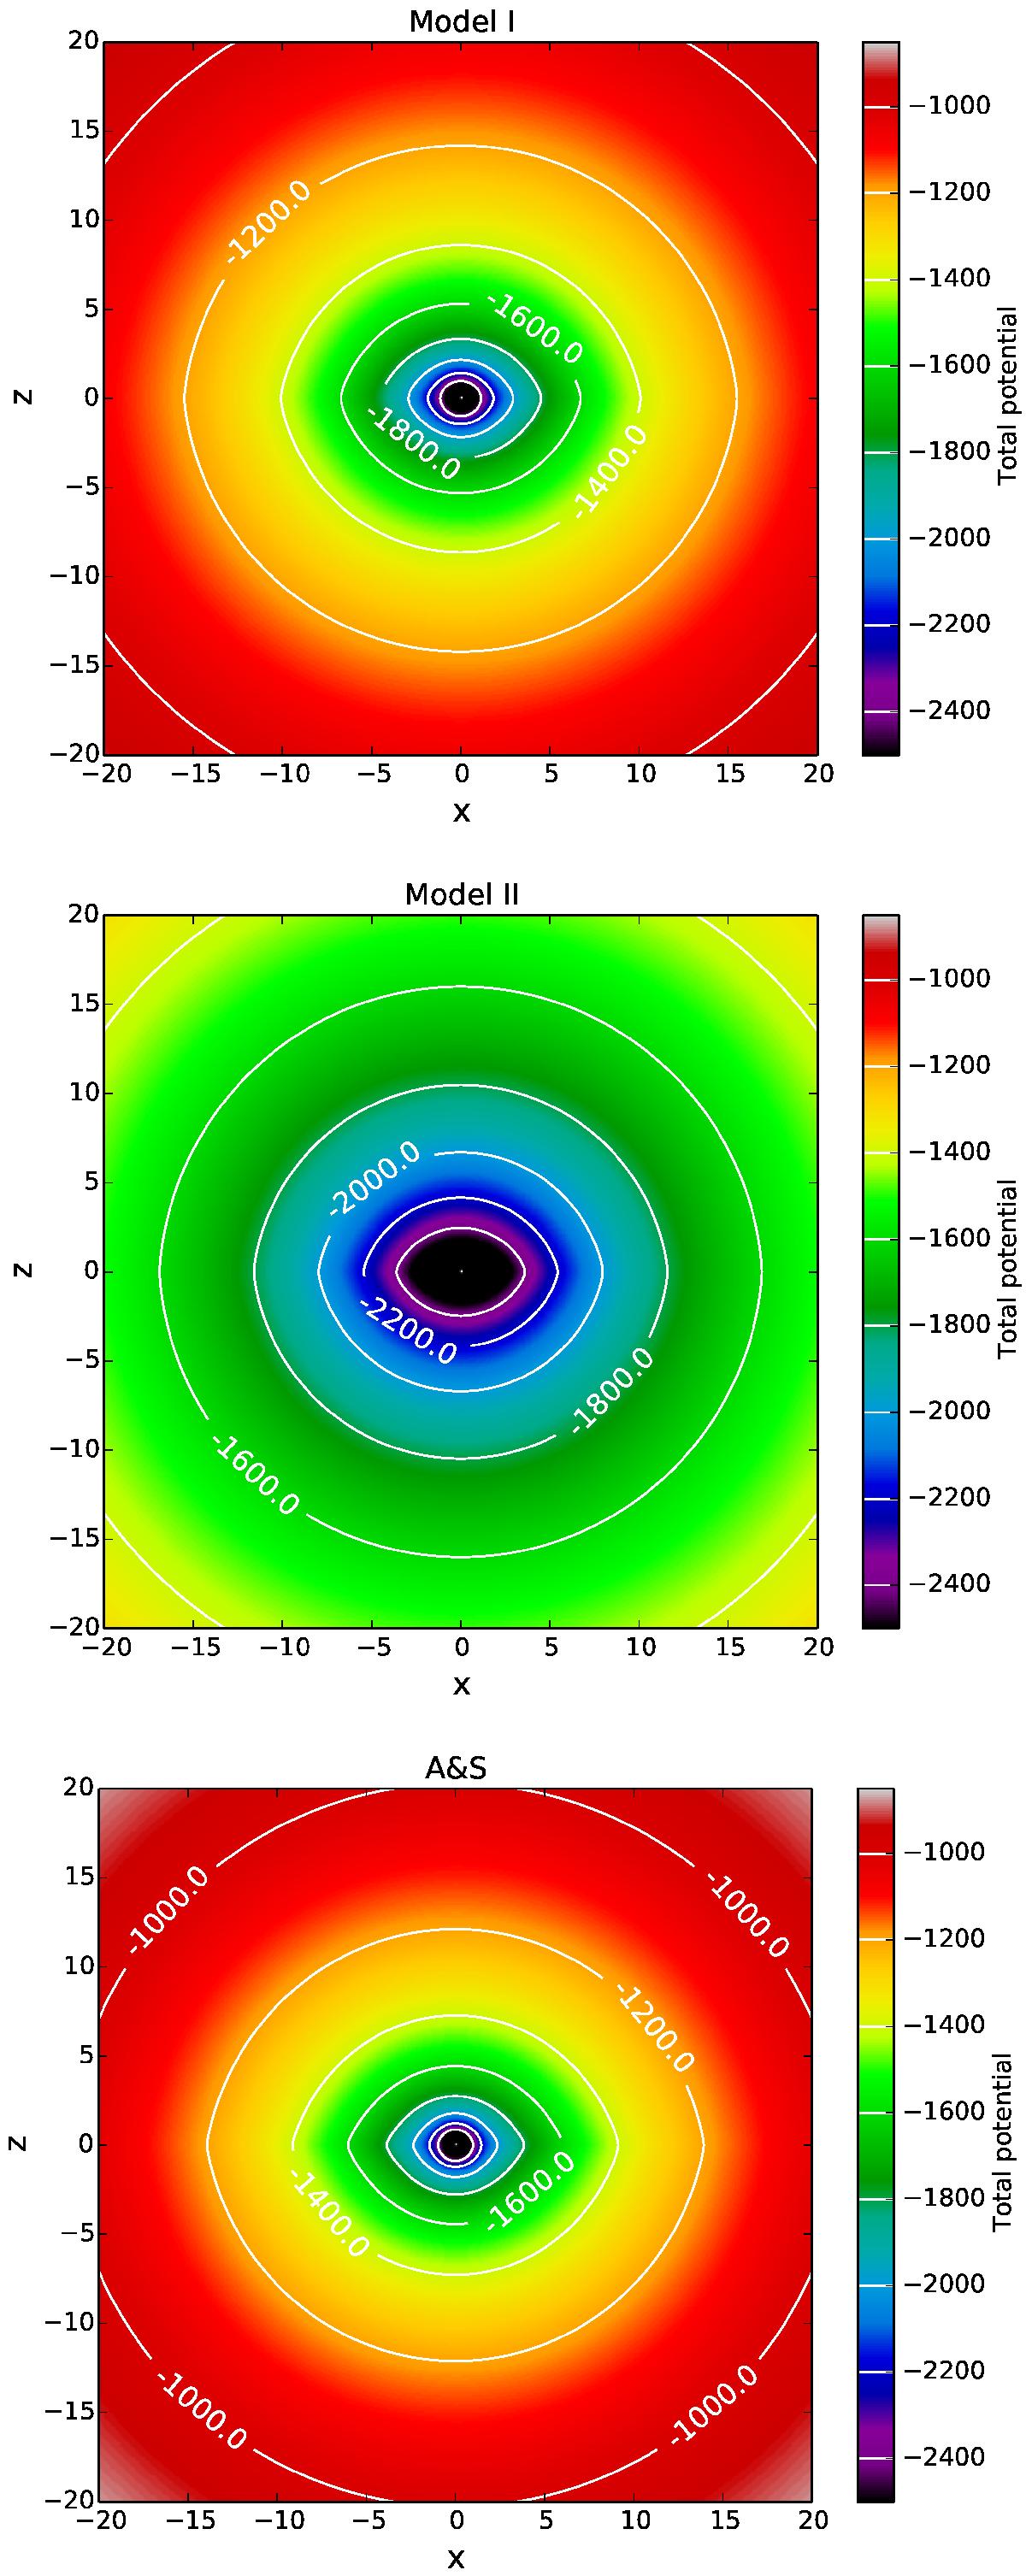
Maps of the total (=visible+dark matter) potential energy of Model I (top panel), and Model II (middle panel). For comparison, the corresponding density map of Model A&S is also shown. Energies are in units of 100 km2/s2, distances in kpc.
This figure is made of several images, please see below:
Current usage metrics show cumulative count of Article Views (full-text article views including HTML views, PDF and ePub downloads, according to the available data) and Abstracts Views on Vision4Press platform.
Data correspond to usage on the plateform after 2015. The current usage metrics is available 48-96 hours after online publication and is updated daily on week days.
Initial download of the metrics may take a while.