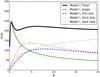
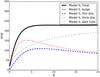
Fig. 3
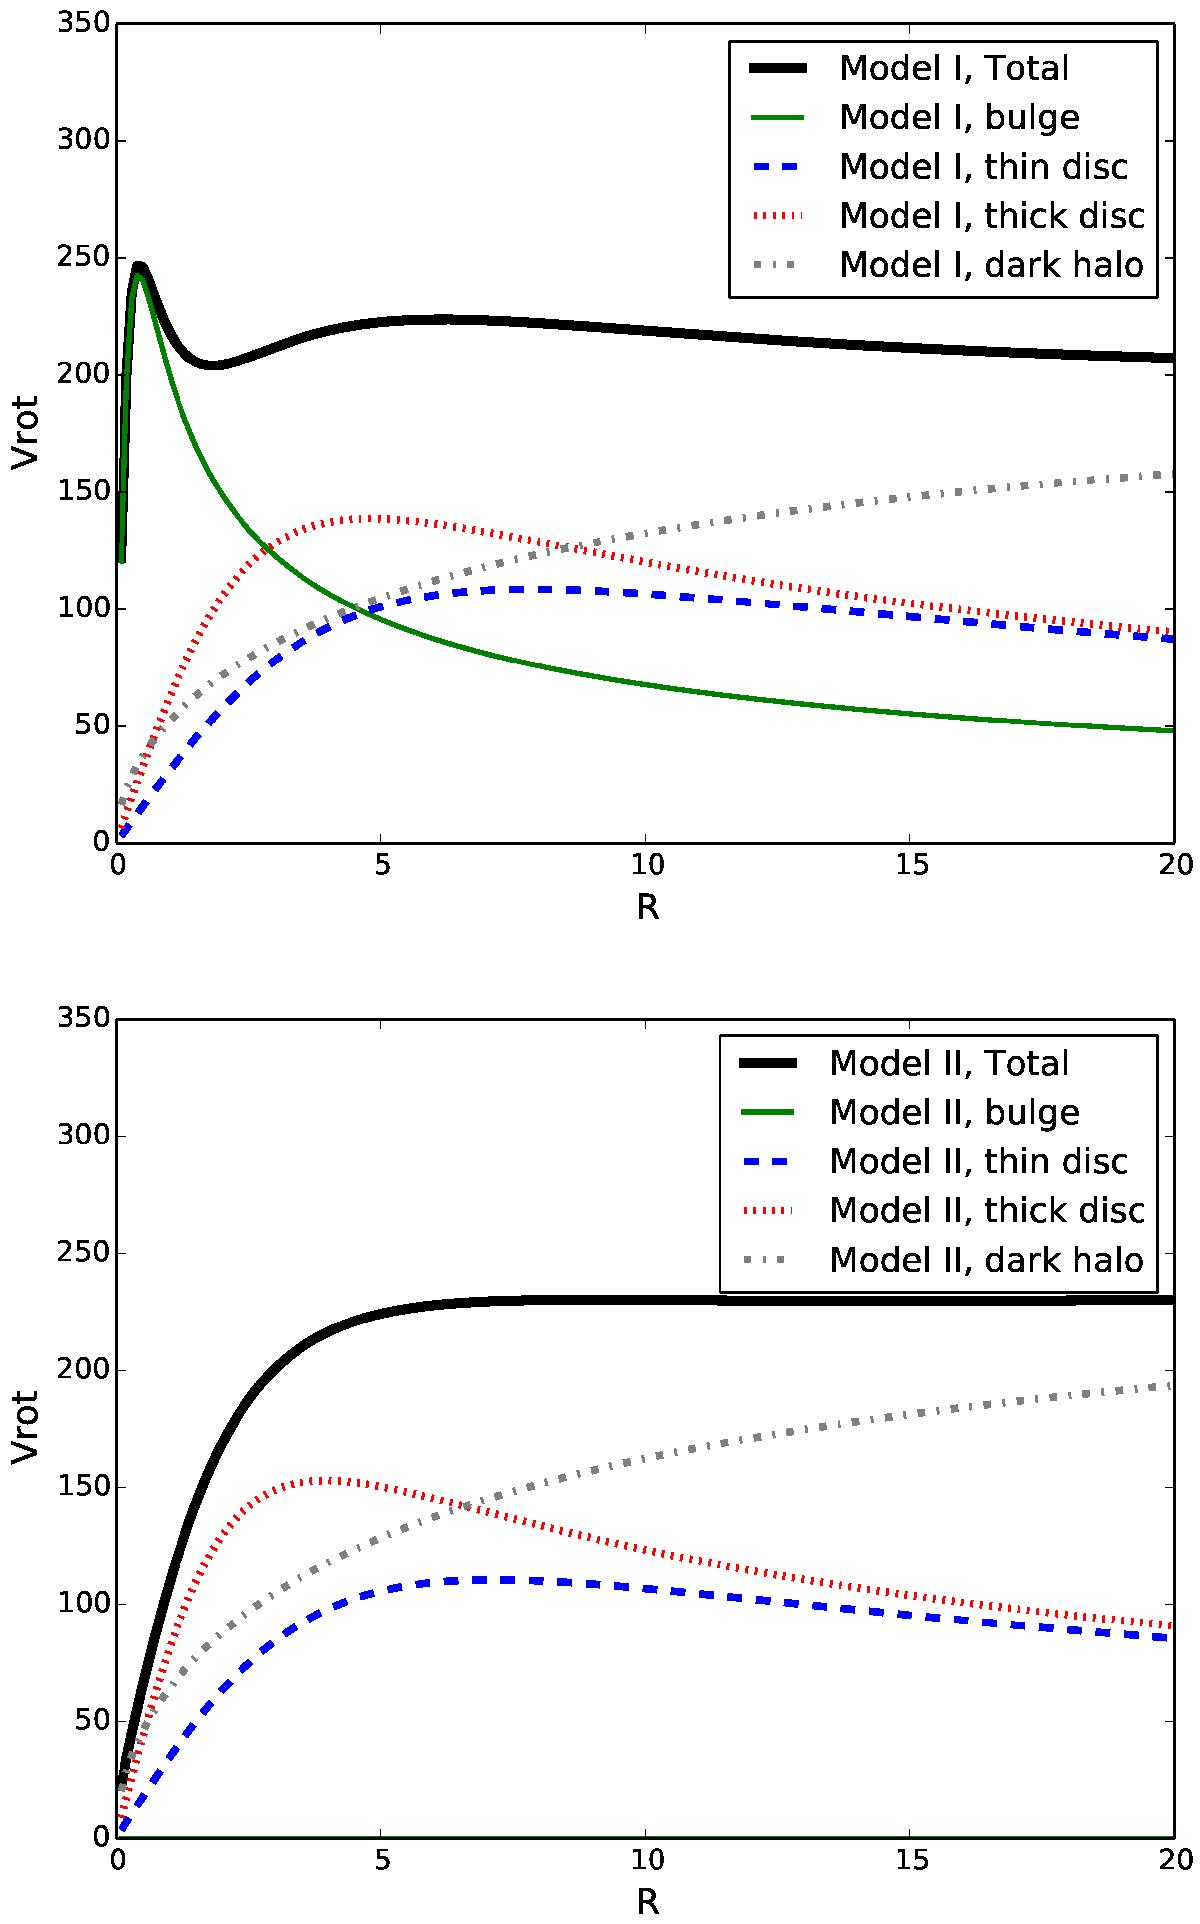
Top panel: total rotation curve of Model I (black line). The contribution to the total rotation curve of the bulge, thin disc, thick disc, and dark matter halo are indicated by the solid green, dashed blue, dotted red, and dot-dashed grey curves, respectively. Velocities are in units of km s-1, distances in kpc. Bottom panel: same as in the top panel, but for Model II.
Current usage metrics show cumulative count of Article Views (full-text article views including HTML views, PDF and ePub downloads, according to the available data) and Abstracts Views on Vision4Press platform.
Data correspond to usage on the plateform after 2015. The current usage metrics is available 48-96 hours after online publication and is updated daily on week days.
Initial download of the metrics may take a while.