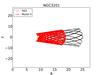
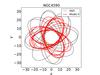
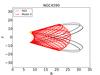
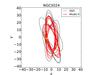
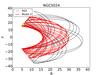
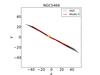
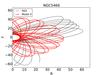
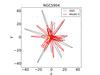
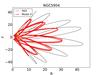
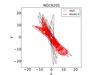
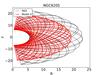
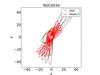
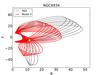
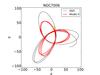
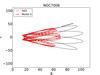
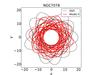
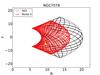
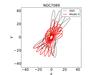
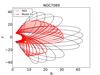
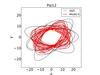
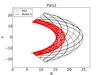
Fig. A.2
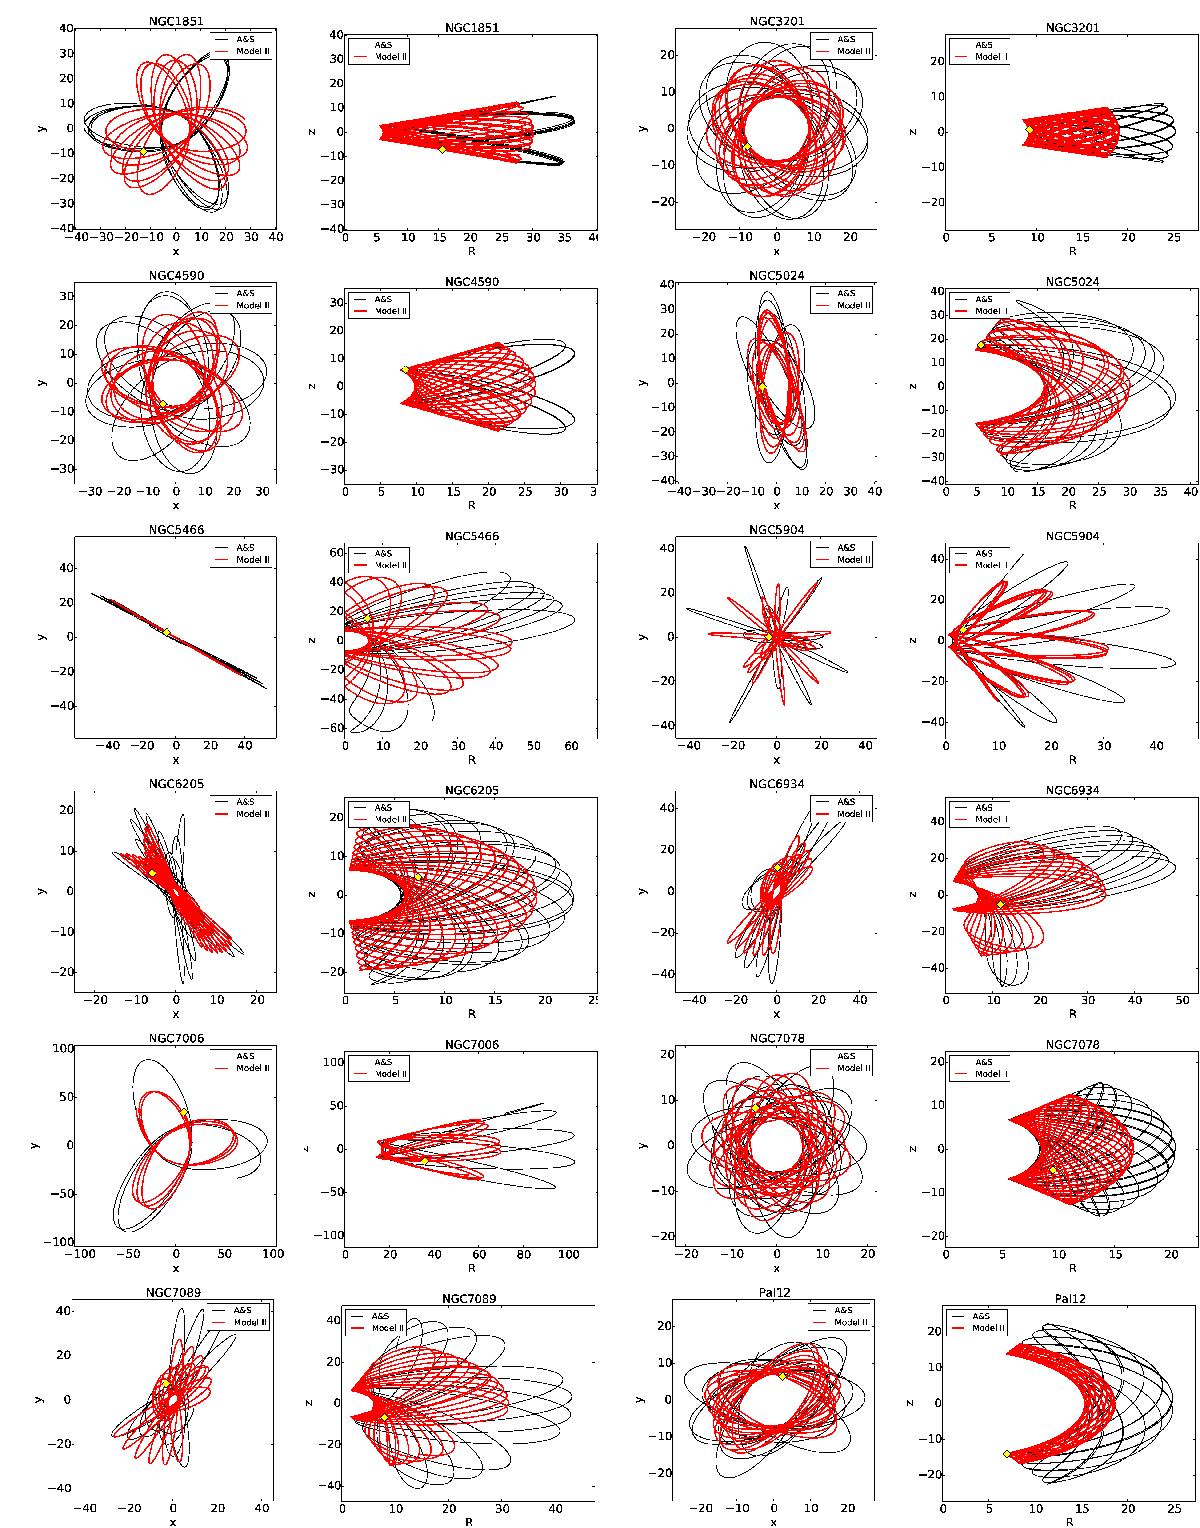
Projections in the x−y and in the R−z planes of the orbits of the Galactic globular clusters NGC 1851, NGC 3201, NGC 4590, NGC 5024, NGC 5466, NGC 5904, NGC 6205, NGC 6934, NGC 7006, NGC 7078, NGC 7089, and Pal 12. In each plot, the black curve corresponds to the orbit predicted by Model A&S, the red curve to that predicted by Model II, as indicated in the legend, and the yellow diamond indicates the current position of the cluster.
Current usage metrics show cumulative count of Article Views (full-text article views including HTML views, PDF and ePub downloads, according to the available data) and Abstracts Views on Vision4Press platform.
Data correspond to usage on the plateform after 2015. The current usage metrics is available 48-96 hours after online publication and is updated daily on week days.
Initial download of the metrics may take a while.