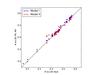
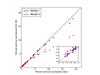
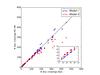
Fig. A.1
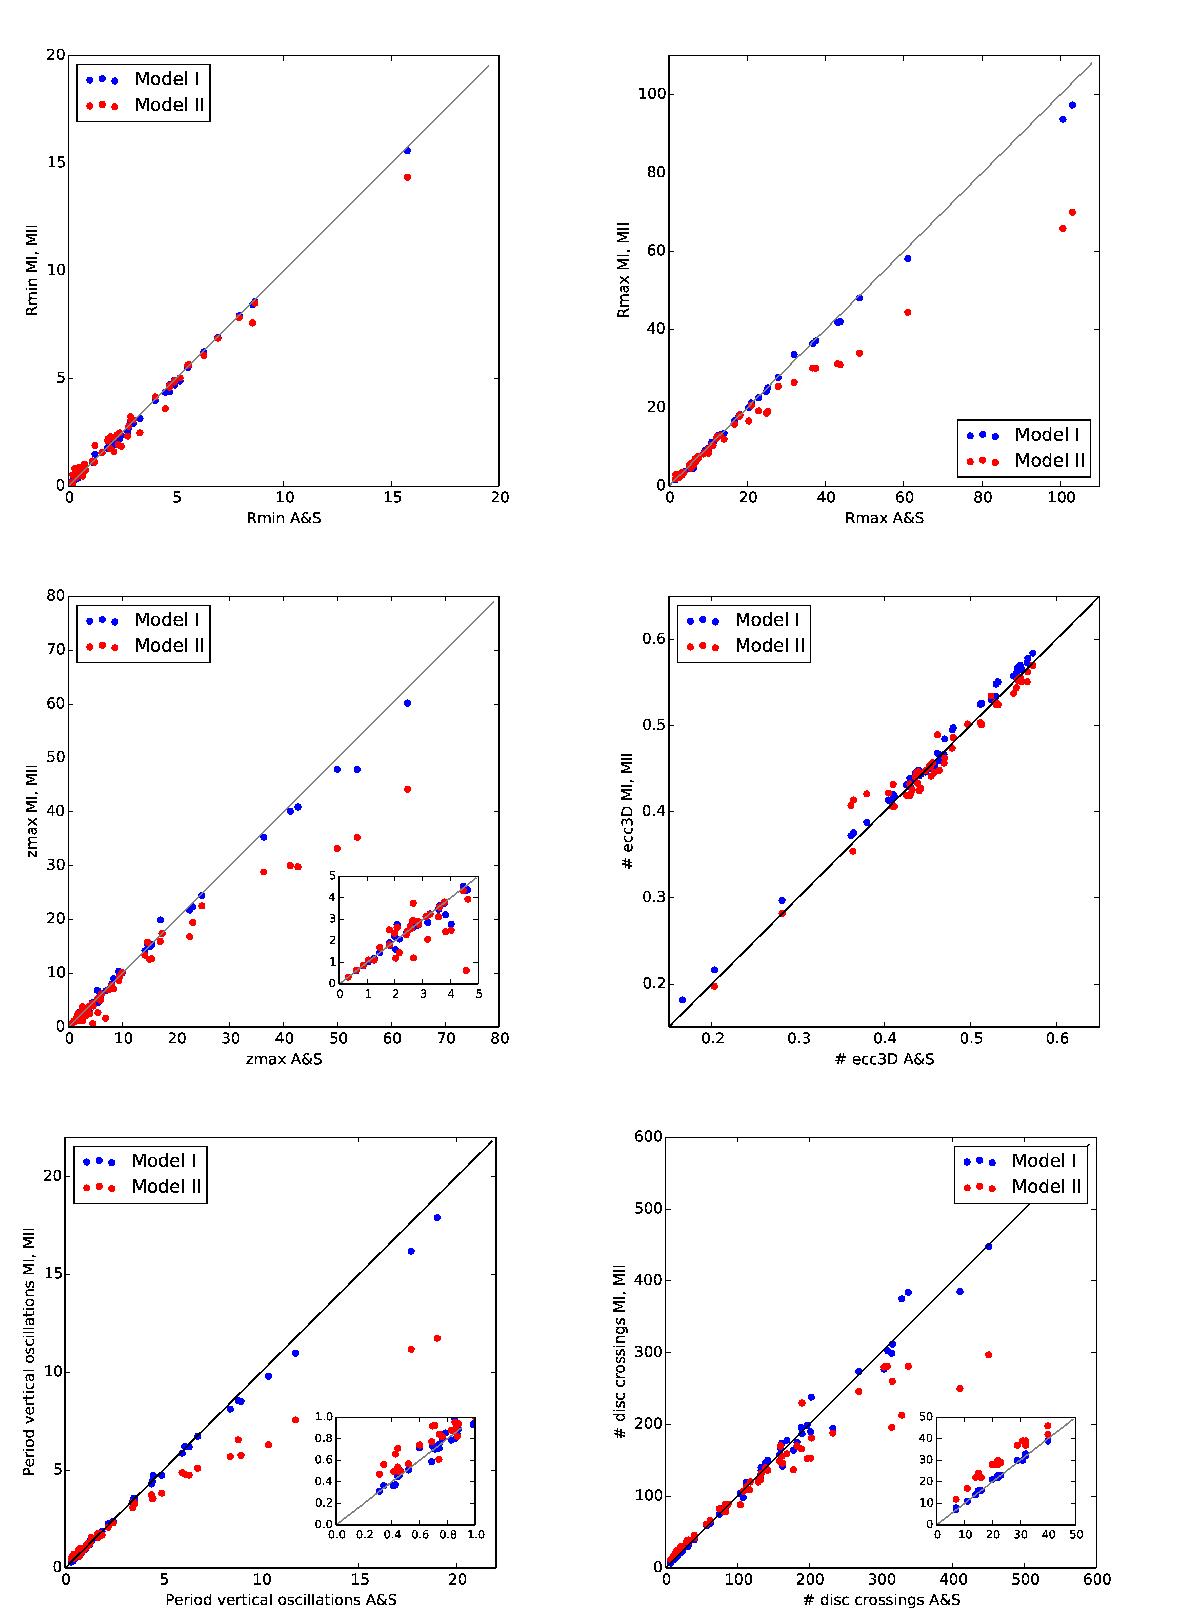
Comparison of the orbital characteristics of Galactic globular clusters integrated in Model I (blue points) and Model II (red points) versus the Allen & Santillan (1991) model. From top-left to bottom-right: pericentres Rmin, apocentres Rmax, maximum vertical distance from the plane zmax, period of vertical oscillations, and 3D eccentricities are given. The insets in some of the plots show a zoom in the inner regions. In all the plots, distances are in kpc, time in units of 108 yr.
Current usage metrics show cumulative count of Article Views (full-text article views including HTML views, PDF and ePub downloads, according to the available data) and Abstracts Views on Vision4Press platform.
Data correspond to usage on the plateform after 2015. The current usage metrics is available 48-96 hours after online publication and is updated daily on week days.
Initial download of the metrics may take a while.