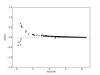
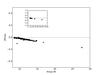
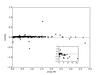
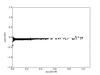
Fig. 10
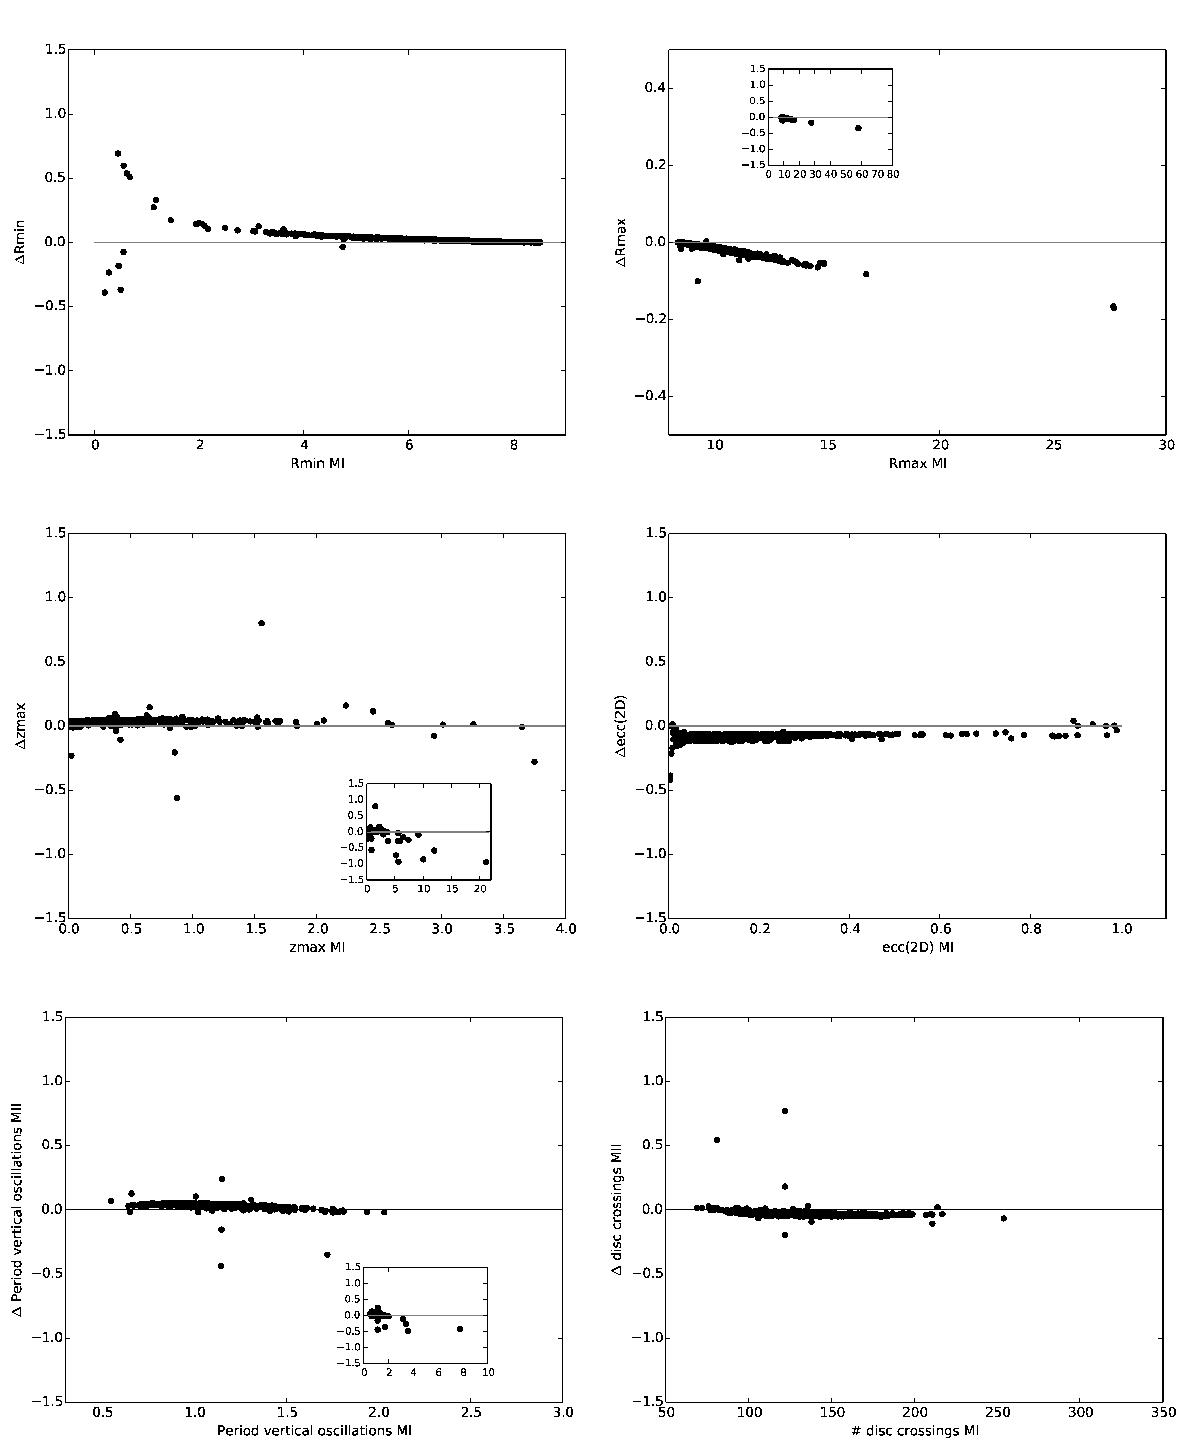
Comparison of the orbital characteristics of stars of the Adibekyan et al. (2012) sample integrated in Model I versus Model II. From top-left to bottom-right: pericentres Rmin, apocentres Rmax, maximum vertical distance from the plane zmax, 2D eccentricities period of vertical oscillations, and number of disc crossings are given. The insets in some plots show a larger range of values than that covered in the corresponding main plots. In all the plots, the y-axis shows the difference between Models II and I, relative to Model I. Distances are in kpc, time in units of 108 yr.
Current usage metrics show cumulative count of Article Views (full-text article views including HTML views, PDF and ePub downloads, according to the available data) and Abstracts Views on Vision4Press platform.
Data correspond to usage on the plateform after 2015. The current usage metrics is available 48-96 hours after online publication and is updated daily on week days.
Initial download of the metrics may take a while.