Fig. 1
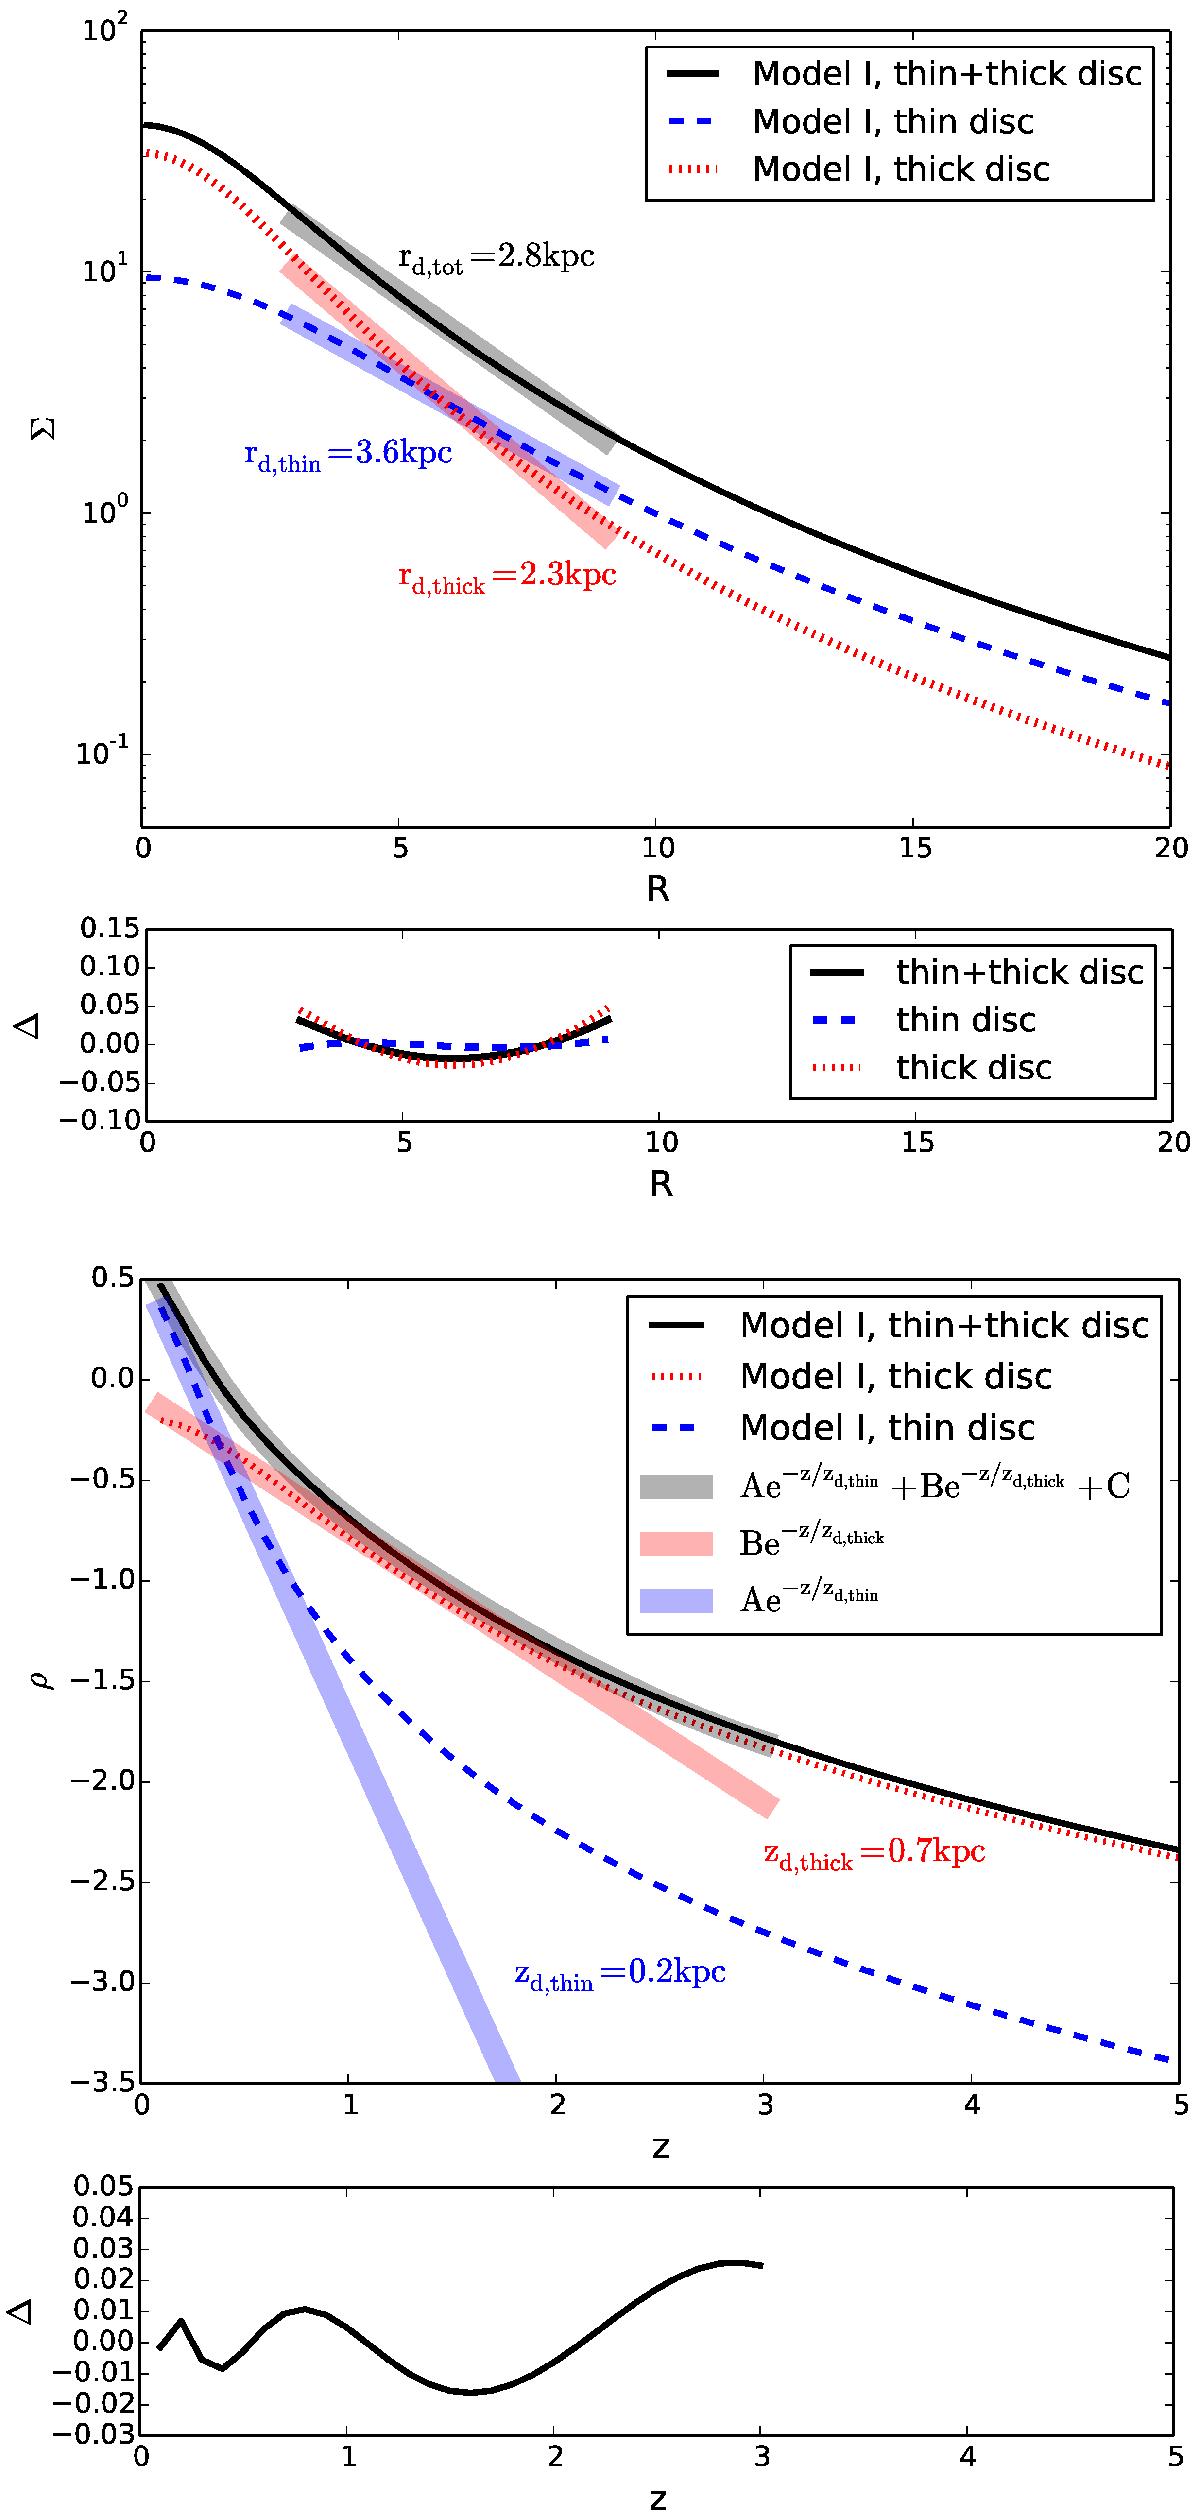
From top to bottom, first panel: total radial surface density (solid black curve), thin disc surface density (dashed blue curve), and thick disc surface density (dotted red curve) of Model I. For each curve, the shaded area shows the exponential fit to the curve, in the distance range of 3–9 kpc. The corresponding exponential disc scale lengths of the total, thin, and thick discs are reported in the plot. Densities and distances are in model units. Second panel: residuals of the exponential fit to the density curves in the 3–9 kpc radial range. Third panel: total vertical volume density (solid black curve), thin disc volume density (dashed blue curve), and thick disc volume density (dotted red curve) of Model I. The black shaded line shows the two-exponential fit to the curve, as given in the legend, in the z range of 0–3 kpc. The blue and red shaded lines show the contribution of the exponential thin and thick discs, respectively, to the total vertical density. Bottom panel: residuals of the two exponentials fit to the total vertical density in the 0–3 kpc z-range. The residuals in this and in the second panel are defined as the difference between the densities and the fit functions, both expressed in logarithmic scale.
Current usage metrics show cumulative count of Article Views (full-text article views including HTML views, PDF and ePub downloads, according to the available data) and Abstracts Views on Vision4Press platform.
Data correspond to usage on the plateform after 2015. The current usage metrics is available 48-96 hours after online publication and is updated daily on week days.
Initial download of the metrics may take a while.