Fig. A.10
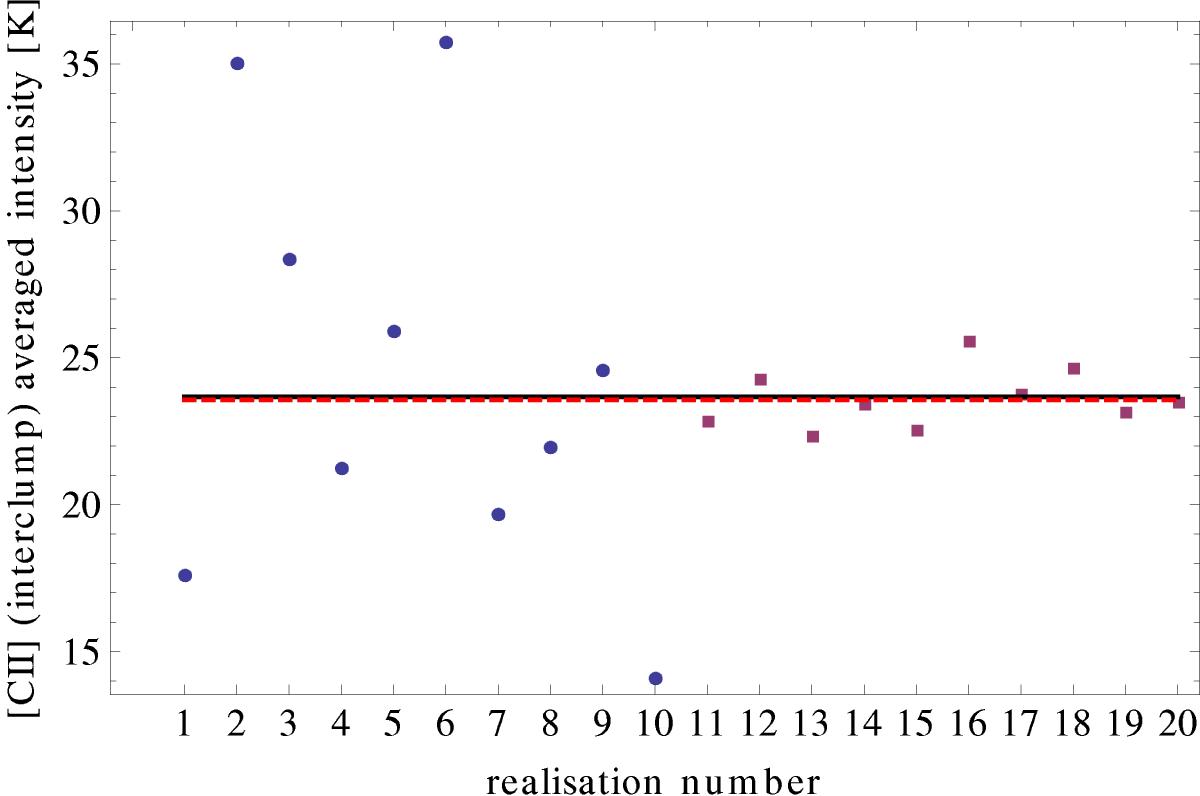
Ensemble-averaged [Cii] line centre intensities of different realisations of the interclump-ensemble. The circles show the ensemble-averaged intensities of ten different maps containing ten clumps and the squares give the values for ten different maps with 100 clumps as presented in Fig. A.9. The black line gives the mean value of the 20 maps, weighted by the respective number of grid points. For the maps with ten clumps the average is (24.4 ± 7.1) K and for the maps with 100 clumps it is (23.6 ± 1.0) K, where the stated error is the standard deviation. The red, dashed line gives the value derived by the probabilistic approach (for NnM = 1 = 100 clumps) for the same ensemble. The two results agree within 0.4% (intensities) and 0.8% (optical depths, not shown).
Current usage metrics show cumulative count of Article Views (full-text article views including HTML views, PDF and ePub downloads, according to the available data) and Abstracts Views on Vision4Press platform.
Data correspond to usage on the plateform after 2015. The current usage metrics is available 48-96 hours after online publication and is updated daily on week days.
Initial download of the metrics may take a while.