Fig. 14
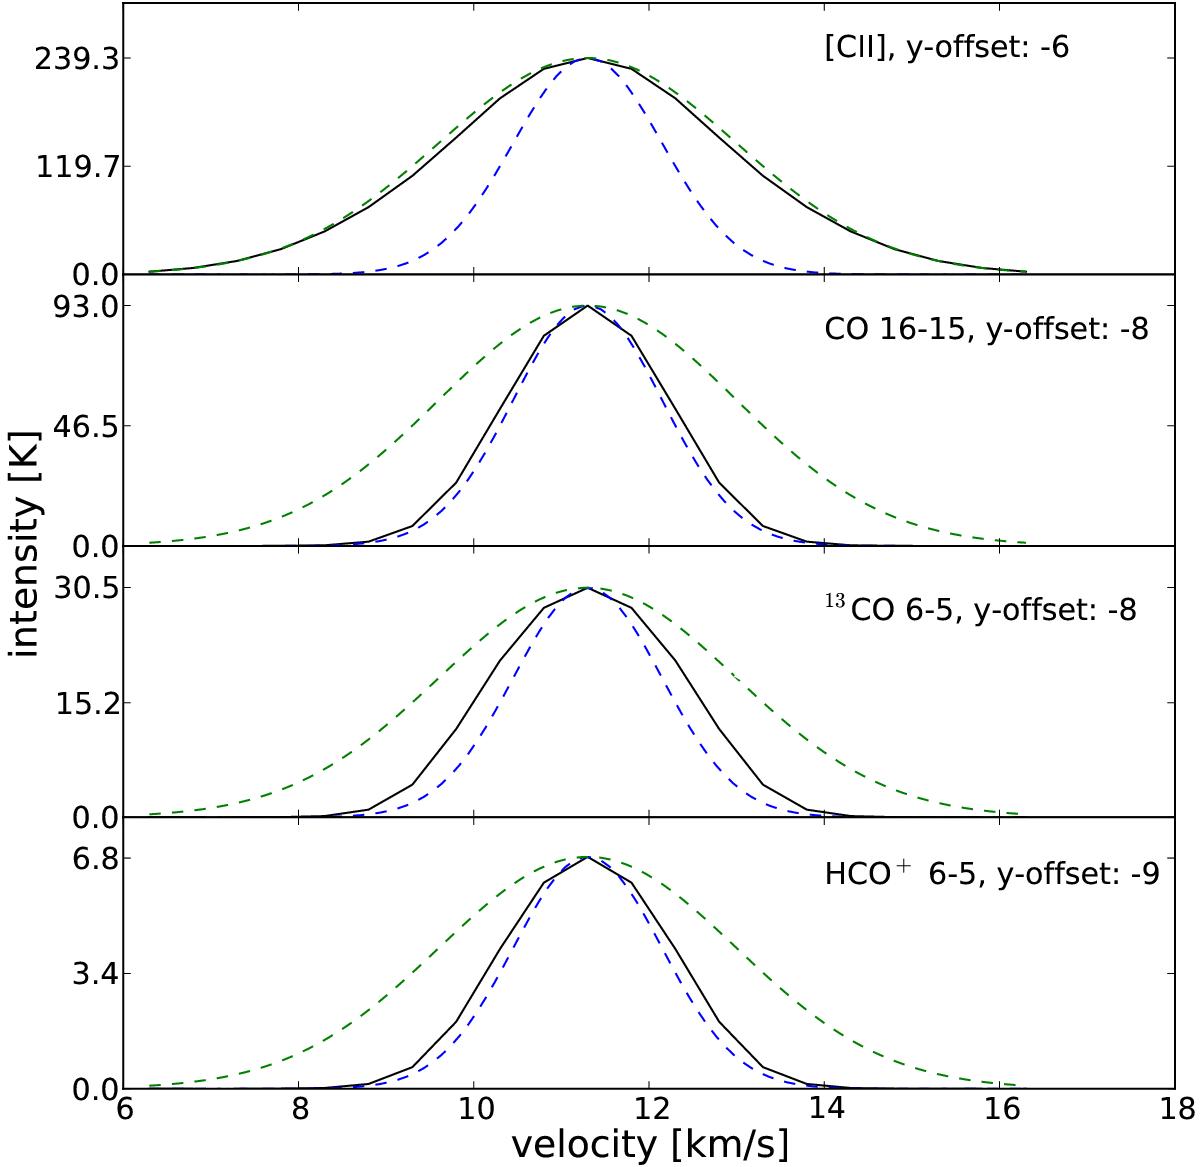
Line profiles of selected transitions of model 6j. The full lines show the simulated profiles, the dashed lines are Gaussian profiles with the same peak intensity as the respective profile, but with linewidths of FWHM = 2 km s-1 and FWHM = 4 km s-1, matching the observed total velocity dispersions. For each transition the y-offset corresponds to the position with the highest line-integrated intensity.
Current usage metrics show cumulative count of Article Views (full-text article views including HTML views, PDF and ePub downloads, according to the available data) and Abstracts Views on Vision4Press platform.
Data correspond to usage on the plateform after 2015. The current usage metrics is available 48-96 hours after online publication and is updated daily on week days.
Initial download of the metrics may take a while.