Fig. 10
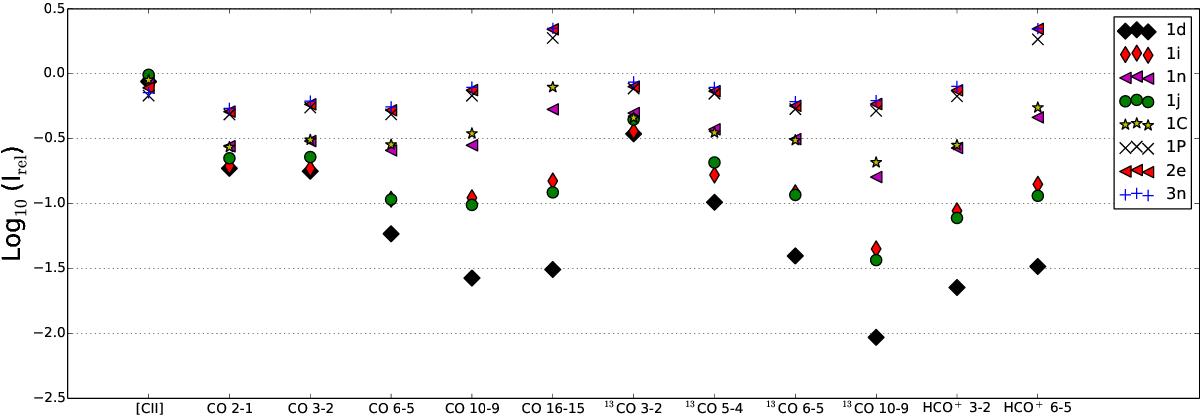
Scatter plot of the line-integrated intensities for selected models from Sects. 5.3.1, 5.3.3 and 5.3.4. For each transition the ratio between simulated and observed line-integrated intensity at the respective peak position, Irel,i = Ifit,i/Iobs,i, is plotted on a logarithmic scale. The different transitions are indicated on the abscissa and different symbols mark the different models.
Current usage metrics show cumulative count of Article Views (full-text article views including HTML views, PDF and ePub downloads, according to the available data) and Abstracts Views on Vision4Press platform.
Data correspond to usage on the plateform after 2015. The current usage metrics is available 48-96 hours after online publication and is updated daily on week days.
Initial download of the metrics may take a while.