Free Access
Fig. 3
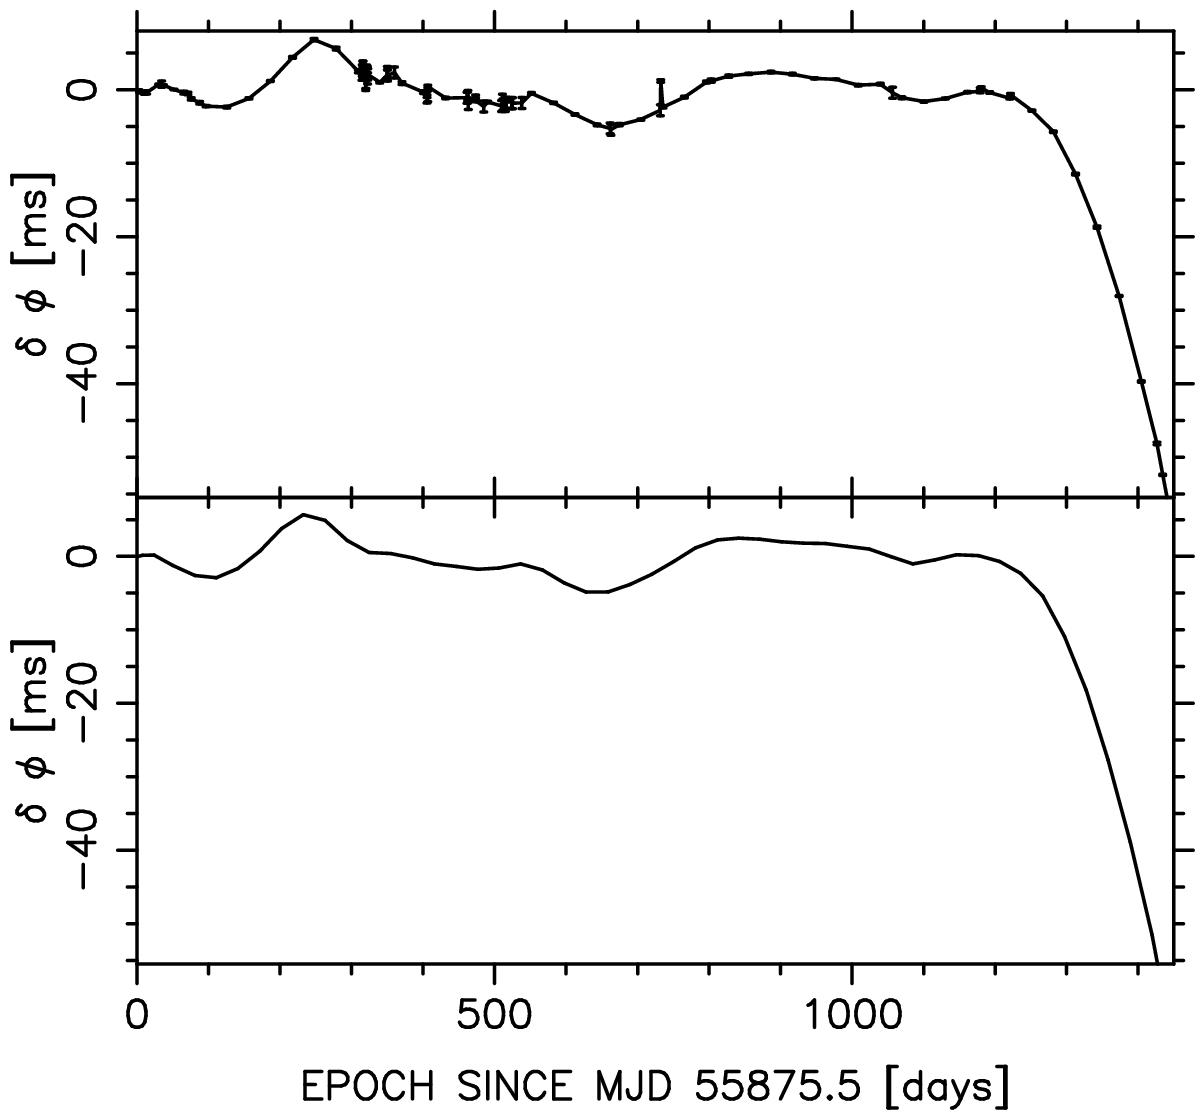
Top panel: phase residuals δφ (in milliseconds) between TOA and Eq. (3), modified as described in the text. The difference between the reference timing models of Sects. 4 and 2 has been taken into account. Bottom panel: integration of the negative of the data in the bottom panel of Fig. 2.
Current usage metrics show cumulative count of Article Views (full-text article views including HTML views, PDF and ePub downloads, according to the available data) and Abstracts Views on Vision4Press platform.
Data correspond to usage on the plateform after 2015. The current usage metrics is available 48-96 hours after online publication and is updated daily on week days.
Initial download of the metrics may take a while.