Free Access
Fig. 2
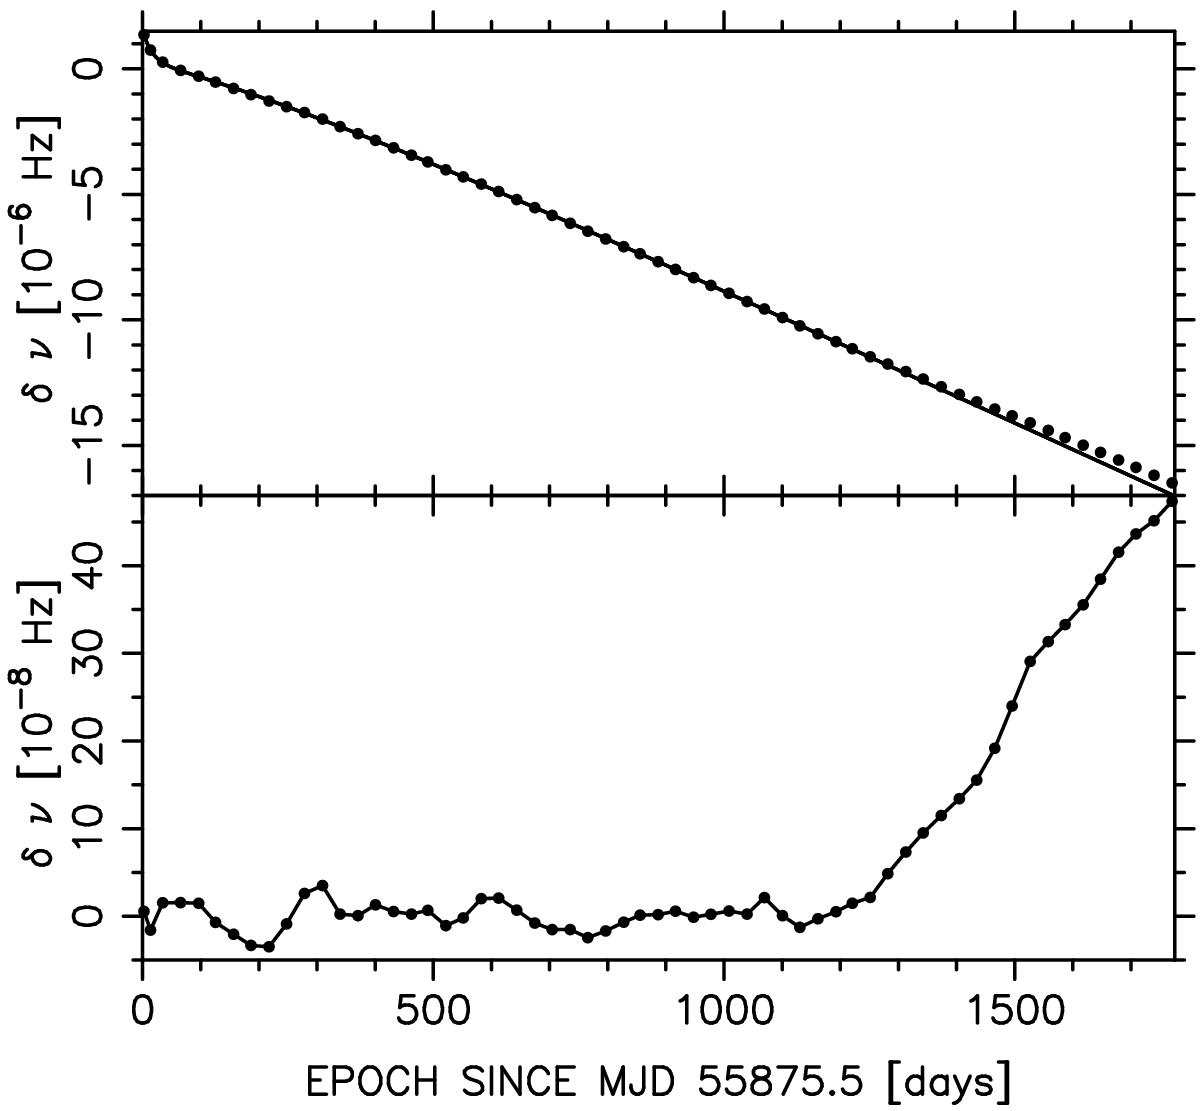
Top panel: frequency residuals δν plotted against epoch since CPG2011. The curve represents the best fit model given in Eq. (2). Bottom panel: difference between the data and the model curve in the top panel. The positive departure of data from the model beyond ≈1200 days is now clearly visible.
Current usage metrics show cumulative count of Article Views (full-text article views including HTML views, PDF and ePub downloads, according to the available data) and Abstracts Views on Vision4Press platform.
Data correspond to usage on the plateform after 2015. The current usage metrics is available 48-96 hours after online publication and is updated daily on week days.
Initial download of the metrics may take a while.