Free Access
Fig. 1
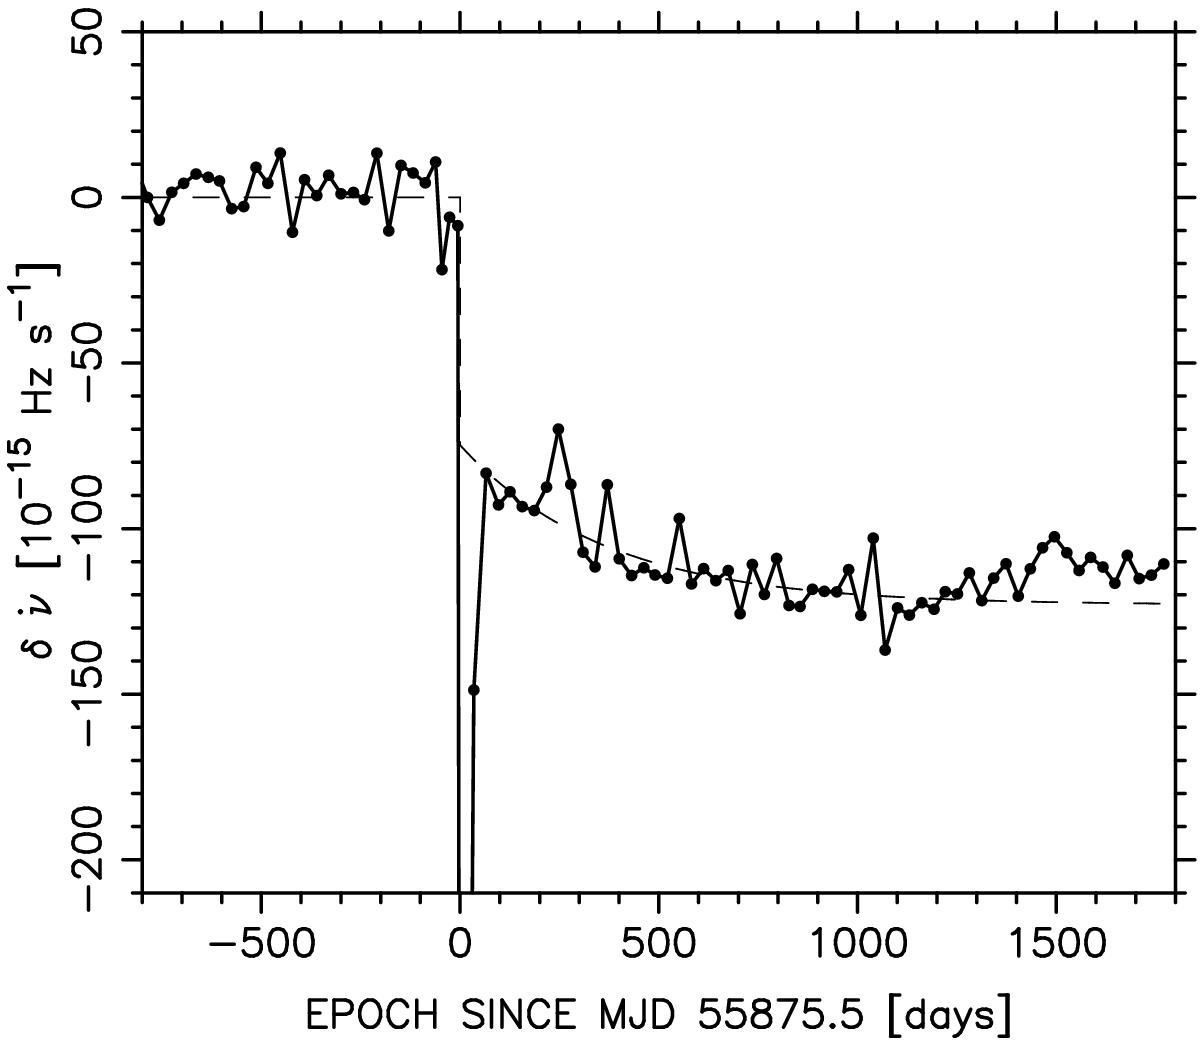
Frequency derivative residual ![]() plotted against epoch since CPG2011. The dashed line before CPG2011 represents the straight line fit to the
plotted against epoch since CPG2011. The dashed line before CPG2011 represents the straight line fit to the ![]() data at negative abscissa. The dashed curve after CPG2011 represents the best fit of the model of Lyne et al. (2015).
data at negative abscissa. The dashed curve after CPG2011 represents the best fit of the model of Lyne et al. (2015).
Current usage metrics show cumulative count of Article Views (full-text article views including HTML views, PDF and ePub downloads, according to the available data) and Abstracts Views on Vision4Press platform.
Data correspond to usage on the plateform after 2015. The current usage metrics is available 48-96 hours after online publication and is updated daily on week days.
Initial download of the metrics may take a while.