Free Access
Fig. 7
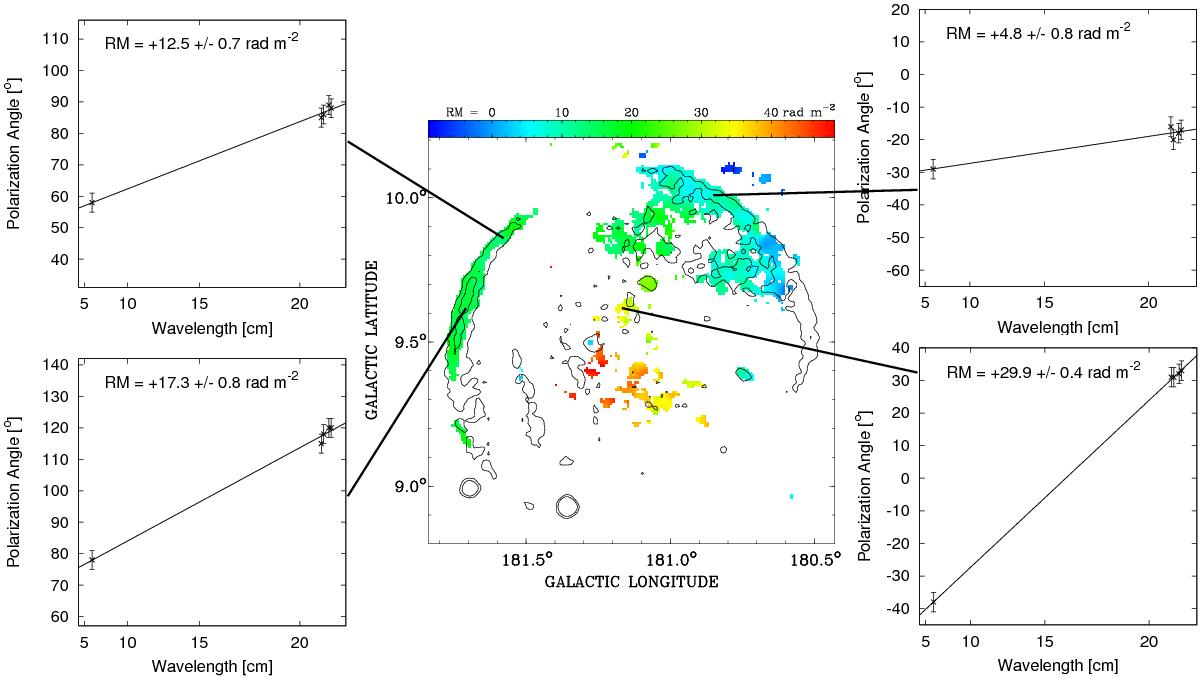
RM map calculated between 4850 MHz and the four bands of the DRAO ST observations around 1420 MHz. Contours of the 4850-MHz PI map are overlaid. Four sample RM spectra are shown representing the three different areas discussed in the text. The resulting RMs and their location on the map are indicated.
Current usage metrics show cumulative count of Article Views (full-text article views including HTML views, PDF and ePub downloads, according to the available data) and Abstracts Views on Vision4Press platform.
Data correspond to usage on the plateform after 2015. The current usage metrics is available 48-96 hours after online publication and is updated daily on week days.
Initial download of the metrics may take a while.