Free Access
Fig. 5
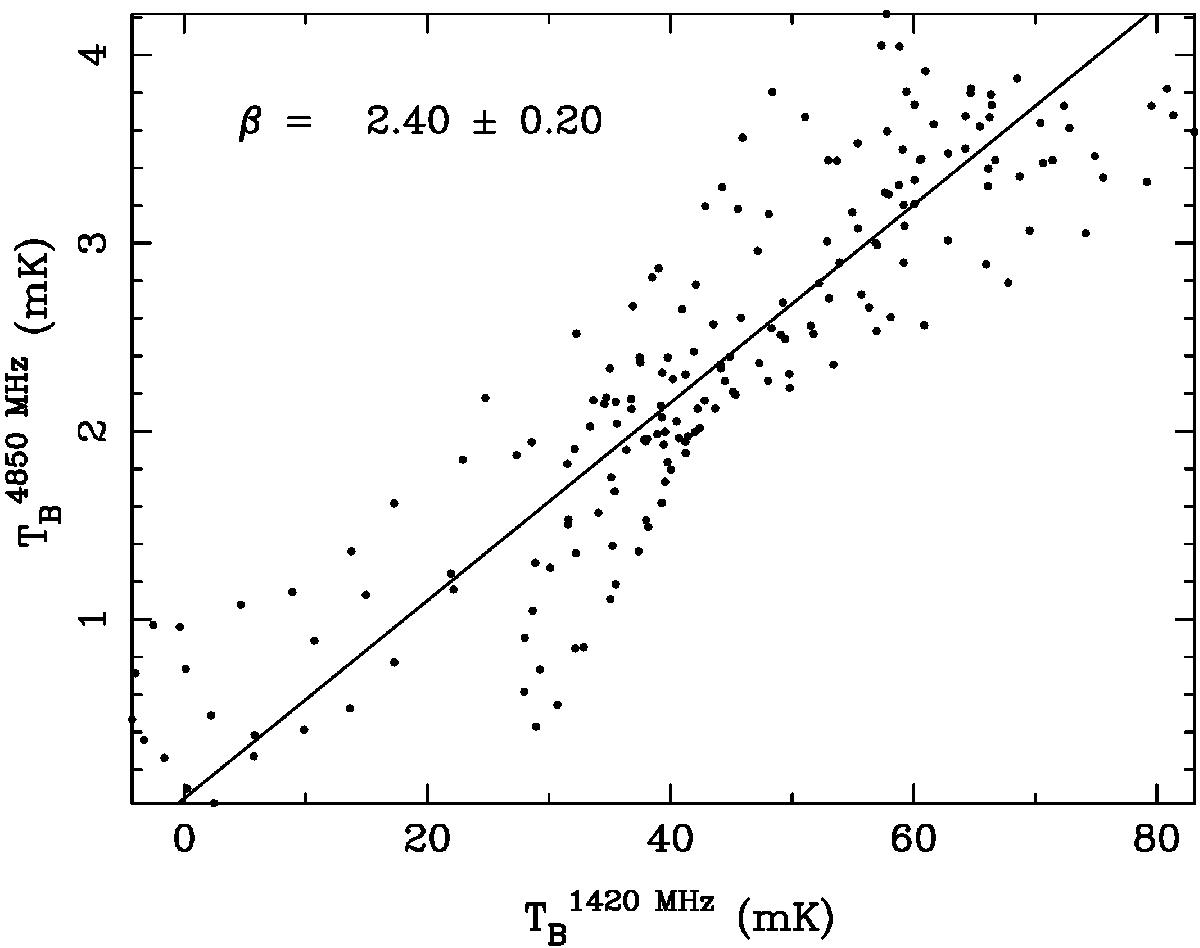
TT-plot of the bright eastern shell of G181.1+9.5 between 4850 MHz and 1420 MHz. Point sources were removed and the maps were convolved to a common resolution of 4′. The resulting temperature spectral index is β = 2.4 ± 0.2.
Current usage metrics show cumulative count of Article Views (full-text article views including HTML views, PDF and ePub downloads, according to the available data) and Abstracts Views on Vision4Press platform.
Data correspond to usage on the plateform after 2015. The current usage metrics is available 48-96 hours after online publication and is updated daily on week days.
Initial download of the metrics may take a while.