Free Access
Fig. 4
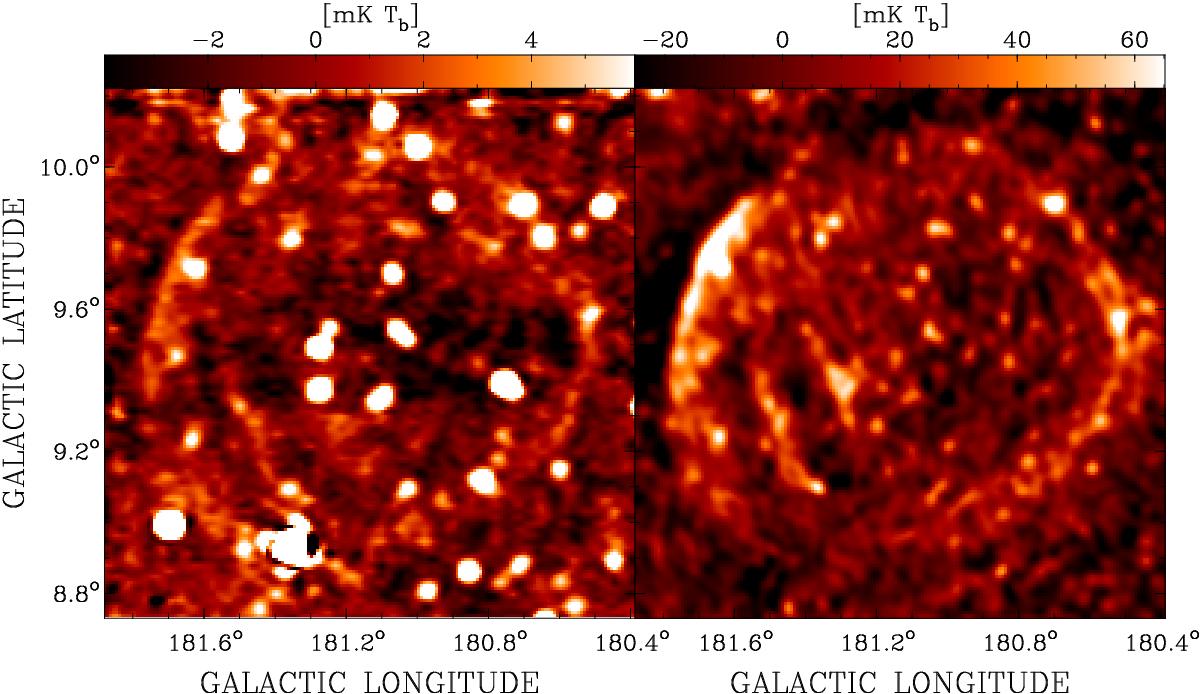
Total power images of G181.1+9.5 at 4850 MHz (left) and 1420 MHz (right). In the 1420-MHz map the brighter point sources have been removed and the map was convolved to the same resolution as the 4850-MHz map of ![]() .
.
Current usage metrics show cumulative count of Article Views (full-text article views including HTML views, PDF and ePub downloads, according to the available data) and Abstracts Views on Vision4Press platform.
Data correspond to usage on the plateform after 2015. The current usage metrics is available 48-96 hours after online publication and is updated daily on week days.
Initial download of the metrics may take a while.