Fig. 11
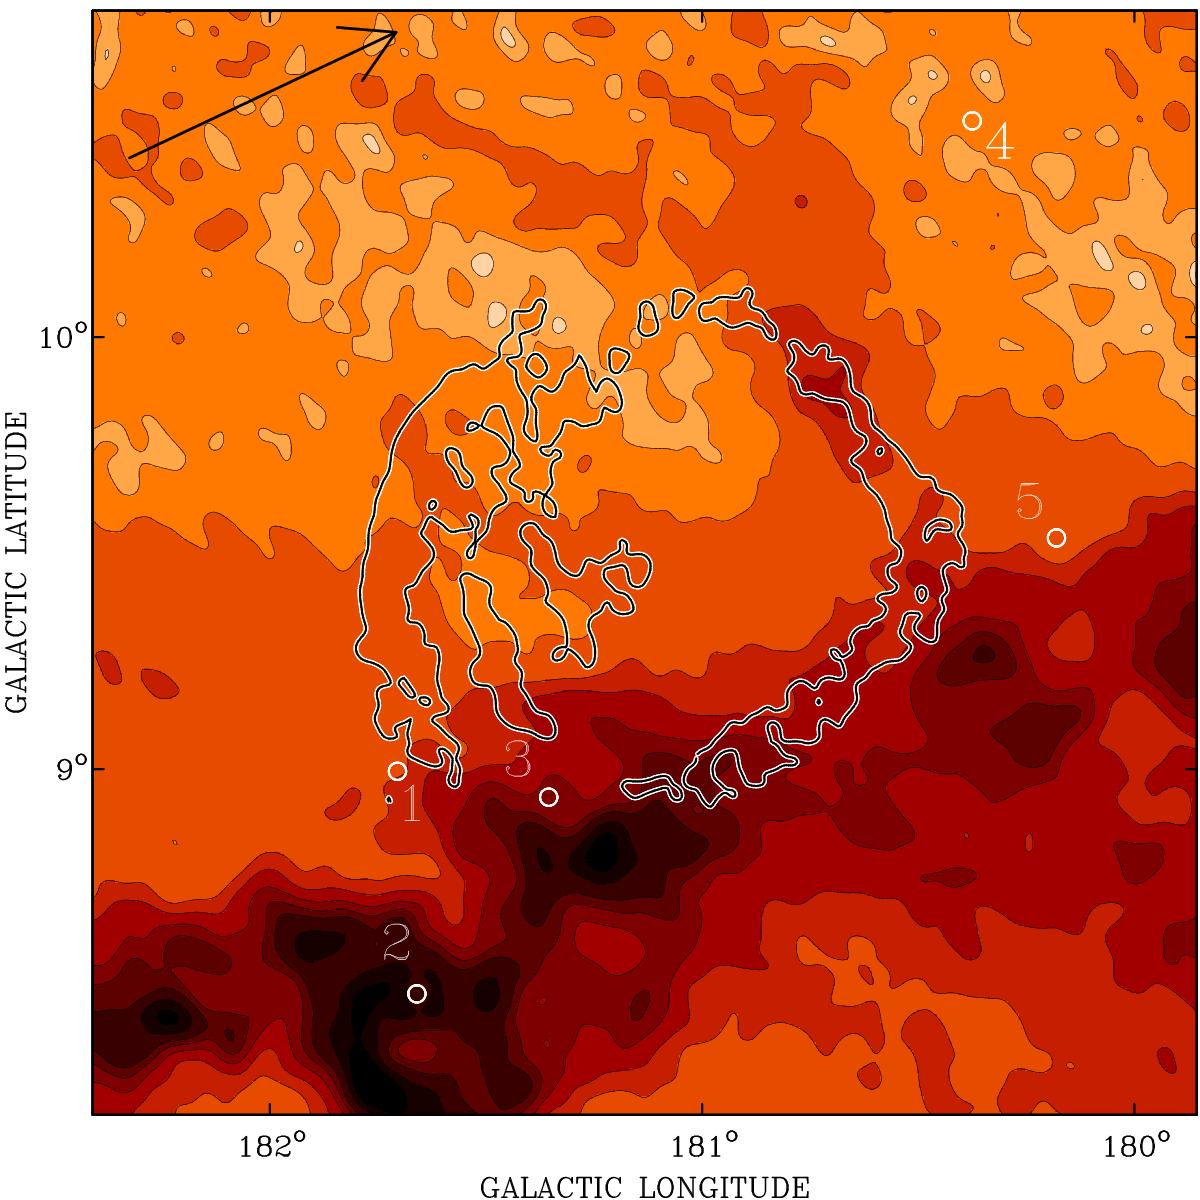
21 cm emission from neutral hydrogen, integrated over velocity range −80 ≥ vLSR ≥ −86 km s-1 to highlight the correspondence of G181.1+9.5’s shell with the HVCs in the northern Anti-centre Shell. Bright H i emission corresponds to dark-black shadings. The resolution of the map has been reduced to 4′. Positions of five unresolved continuum sources used to measure absorption spectra (Fig. 12) are marked with white circles, with source numbers 1–5 referred to in the text (Sect. 3.4). While the map is gridded in Galactic coordinates, for reference the arrow marked in the upper-left corner of the map points towards the north celestial pole.
Current usage metrics show cumulative count of Article Views (full-text article views including HTML views, PDF and ePub downloads, according to the available data) and Abstracts Views on Vision4Press platform.
Data correspond to usage on the plateform after 2015. The current usage metrics is available 48-96 hours after online publication and is updated daily on week days.
Initial download of the metrics may take a while.