Free Access
Fig. 10
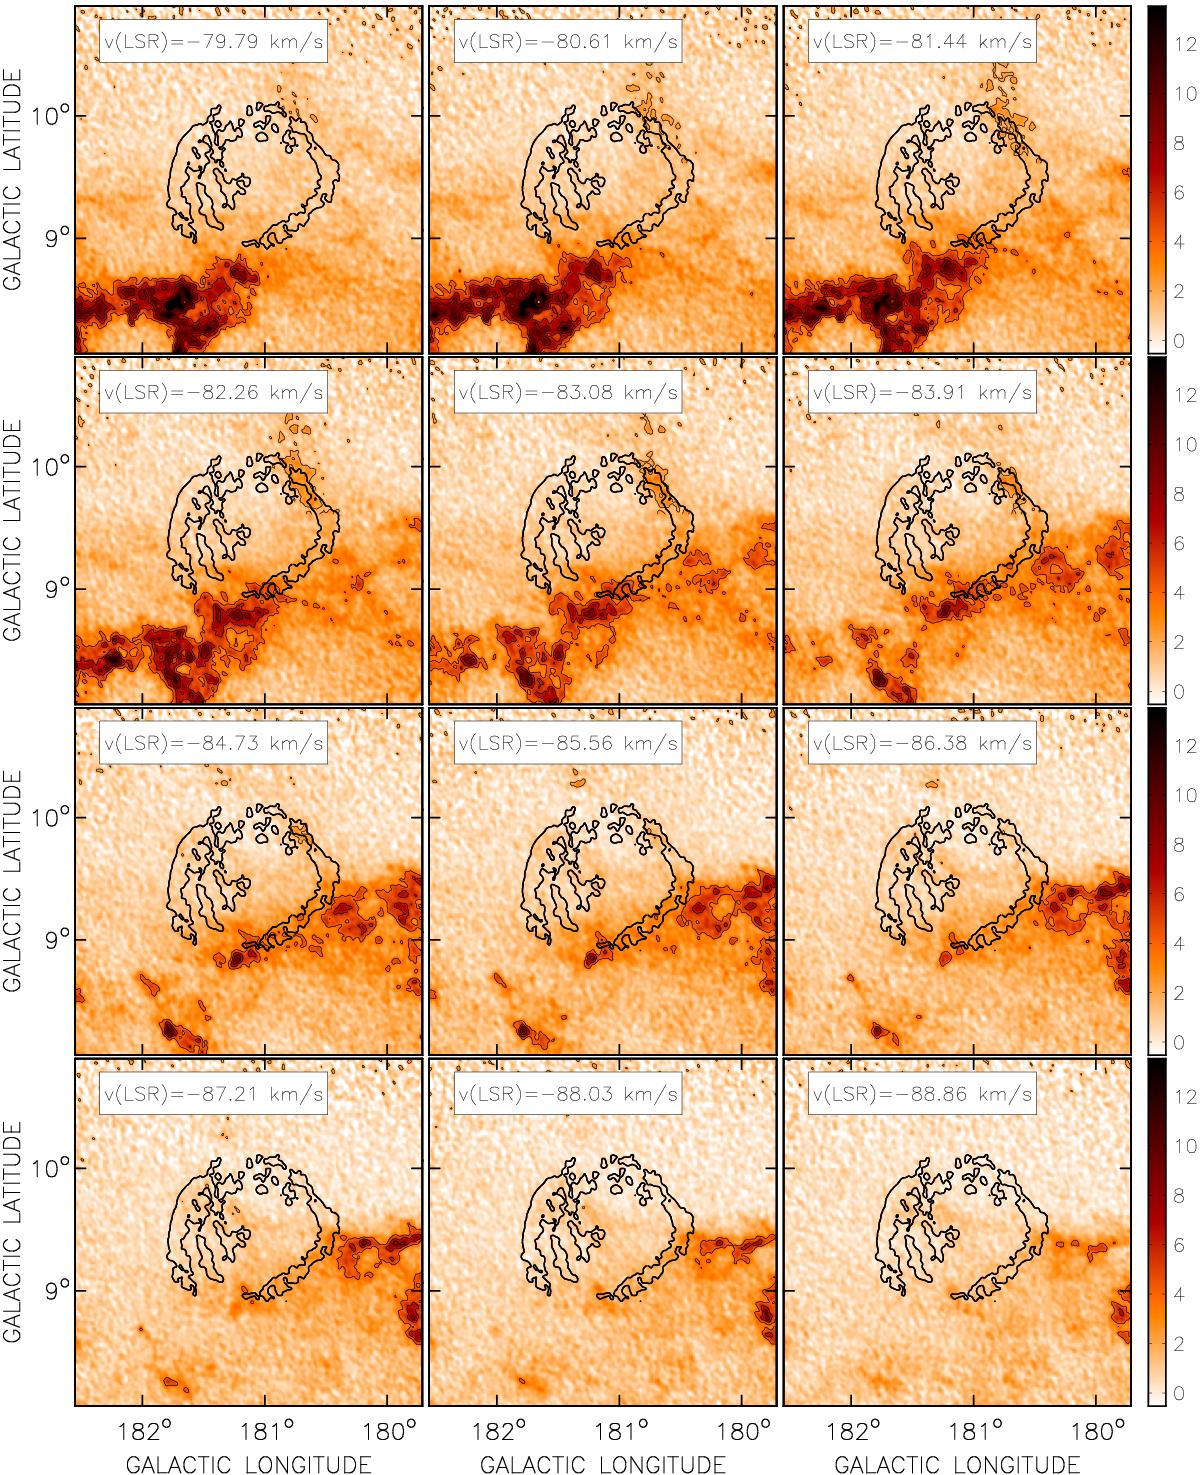
Twelve 21 cm line-channel maps towards G181.1+9.5 in the velocity regime of the HVCs in the area. The colour-bar at right is K TB. Contours around H i emission clouds are at TB = 2, 4, 6, 8 K, and a single thick black contour shows the 1420-MHz total-power appearance of the object.
Current usage metrics show cumulative count of Article Views (full-text article views including HTML views, PDF and ePub downloads, according to the available data) and Abstracts Views on Vision4Press platform.
Data correspond to usage on the plateform after 2015. The current usage metrics is available 48-96 hours after online publication and is updated daily on week days.
Initial download of the metrics may take a while.