Free Access
Fig. 5
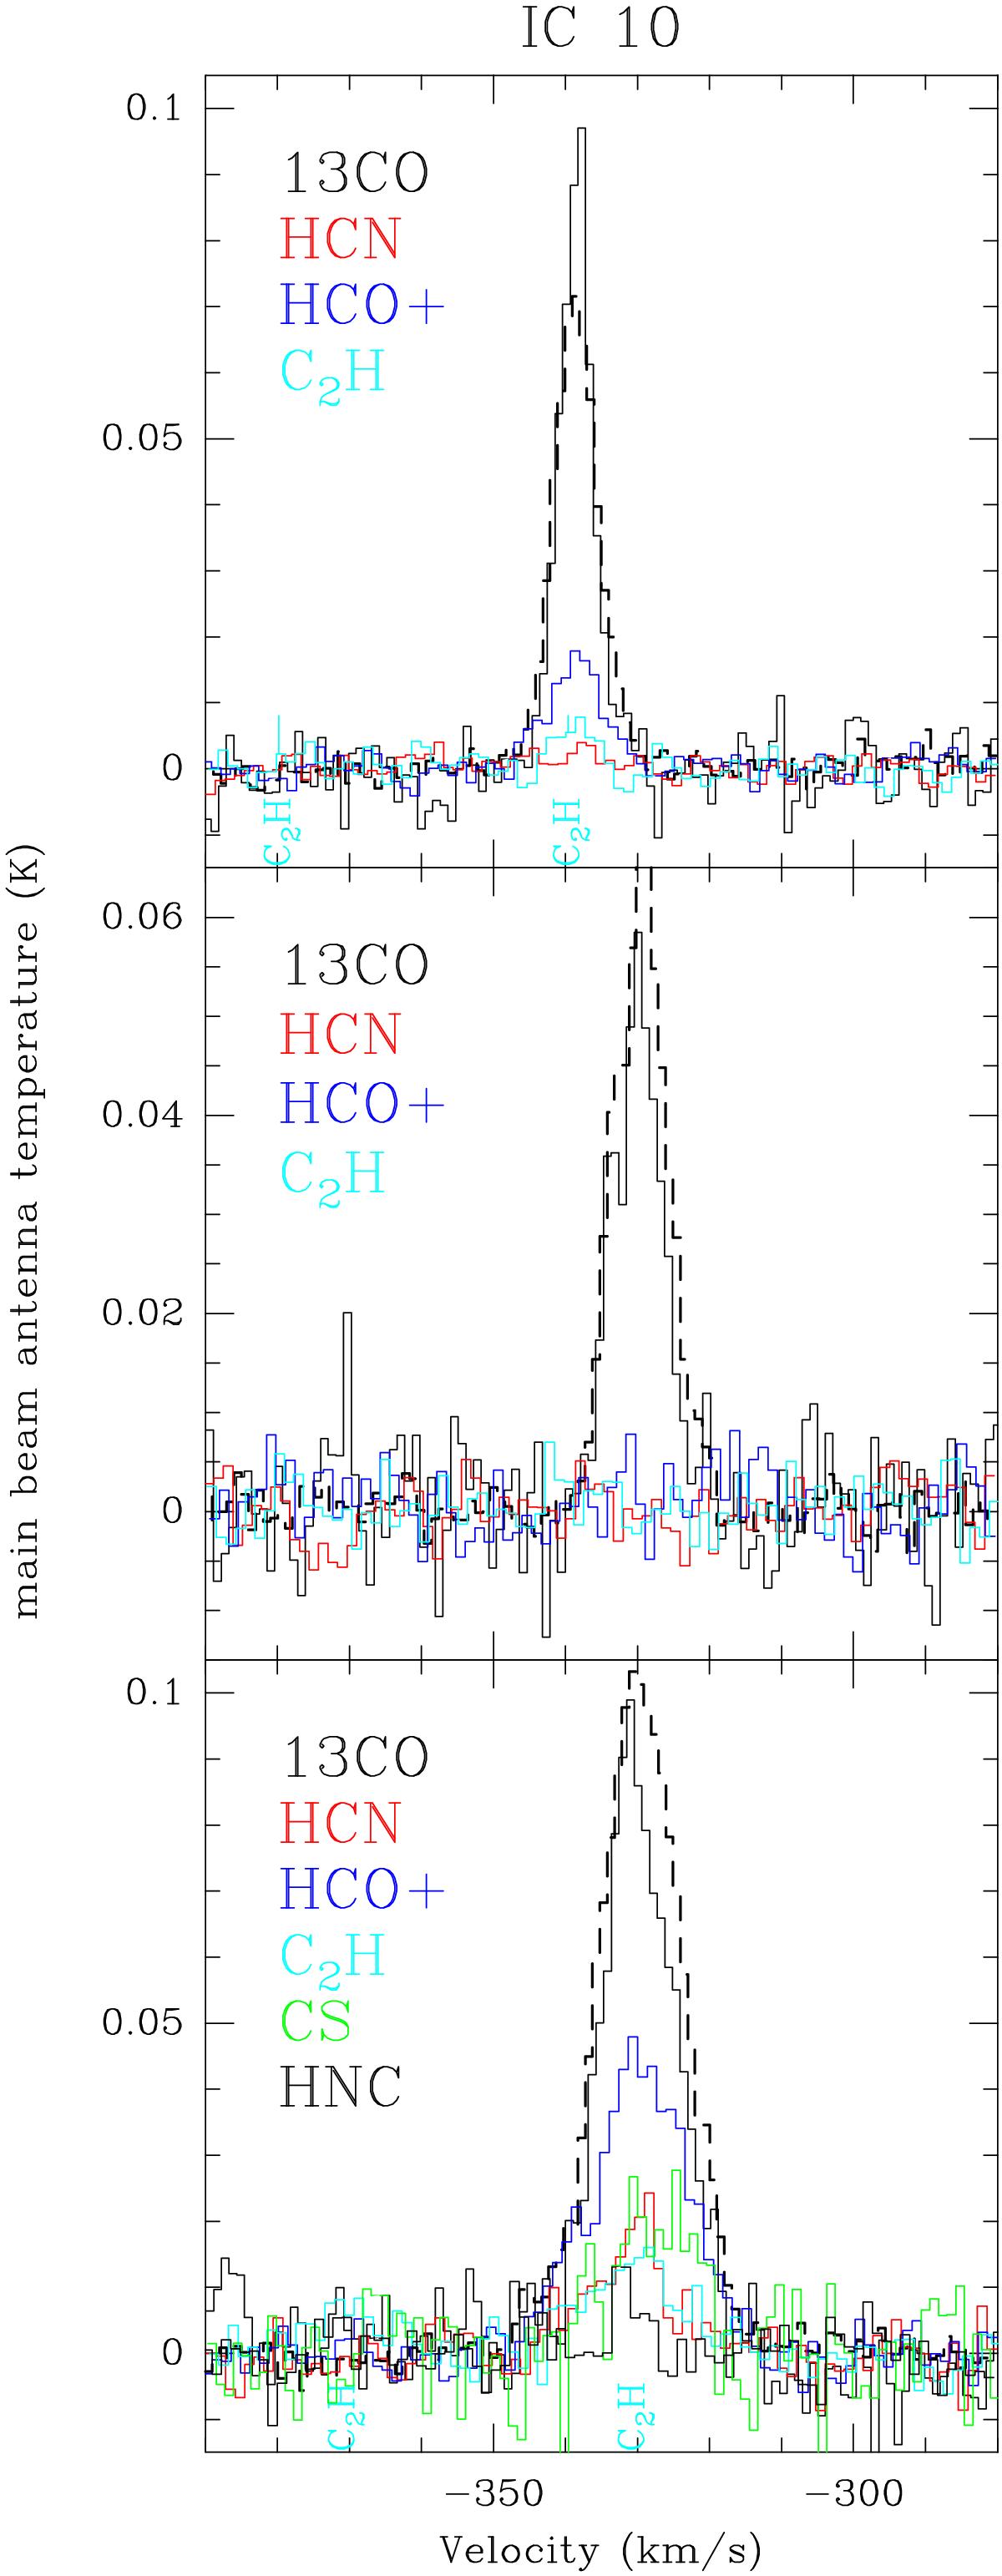
13CO, 12CO and dense gas tracers as observed in the b8, b9, and b11 regions in IC 10. Color coding is indicated in the panel. Note that additional lines were detected in IC 10 b11. The 12CO line scale (dashed) is divided by 10.
Current usage metrics show cumulative count of Article Views (full-text article views including HTML views, PDF and ePub downloads, according to the available data) and Abstracts Views on Vision4Press platform.
Data correspond to usage on the plateform after 2015. The current usage metrics is available 48-96 hours after online publication and is updated daily on week days.
Initial download of the metrics may take a while.