Fig. 3
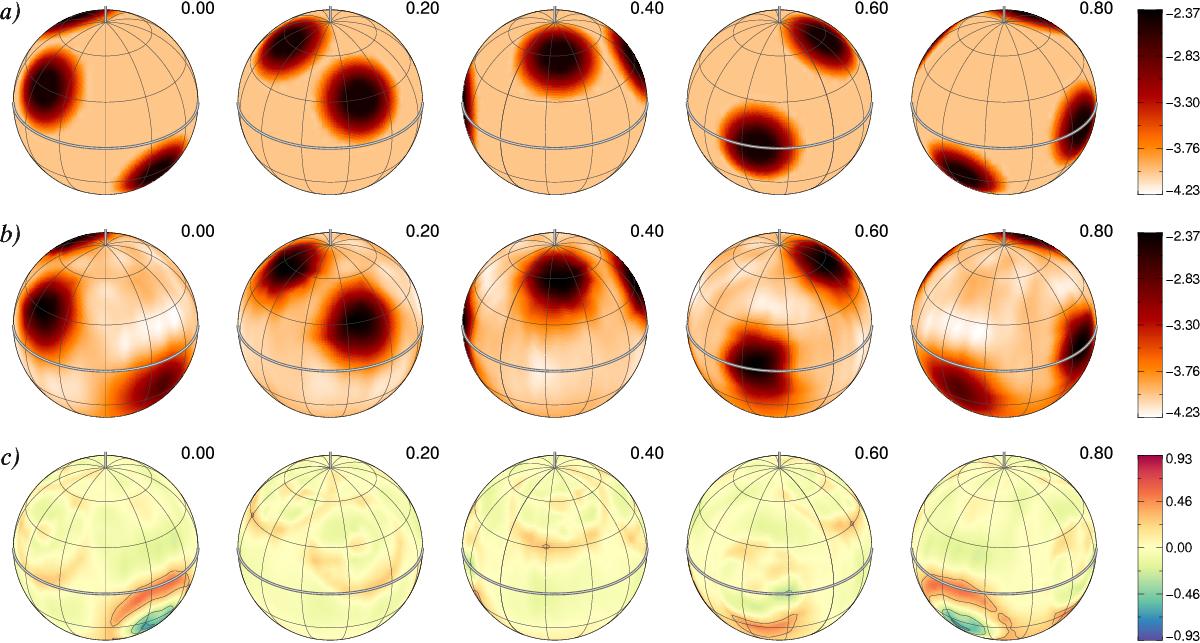
Results of the Fe abundance inversion for the reference test case (4 circular spots, 7 Fe i lines, including magnetic field). The star is shown at five rotation phases, which are indicated above the spherical plots, and an inclination angle of i = 60°. The spherical plots show a) the true abundance map; b) reconstructed abundance map; c) difference map. The contours over the difference map are plotted at ±0.3,0.6,0.9 dex. The thick line and the vertical bar indicate positions of the rotational equator and the pole, respectively. The colour bars give the local abundance in log NFe/Ntot units.
Current usage metrics show cumulative count of Article Views (full-text article views including HTML views, PDF and ePub downloads, according to the available data) and Abstracts Views on Vision4Press platform.
Data correspond to usage on the plateform after 2015. The current usage metrics is available 48-96 hours after online publication and is updated daily on week days.
Initial download of the metrics may take a while.