Fig. 9
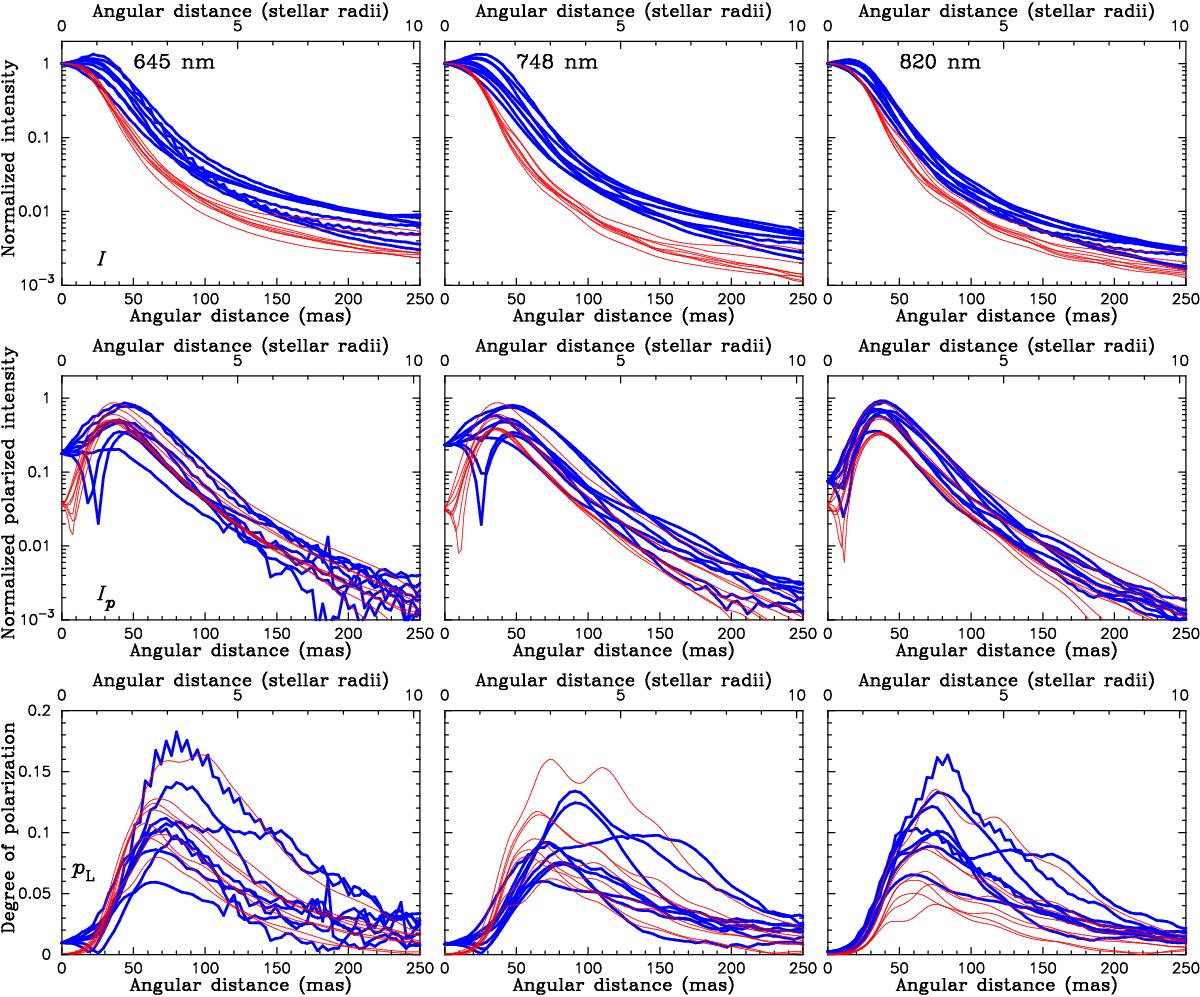
Comparison of the dust clump model and the observed SPHERE-ZIMPOL data. The top, middle, and bottom rows show the 1D cuts at eight different position angles (0°, 45°, 90°, ..., 315°) of the intensity, normalized polarized intensity, and degree of polarization maps, respectively. The first, second, and third columns show the comparison at 645, 748, and 820 nm, respectively. In each panel, the observed data are plotted with the thick blue lines, while the model is plotted with the thin red lines.
Current usage metrics show cumulative count of Article Views (full-text article views including HTML views, PDF and ePub downloads, according to the available data) and Abstracts Views on Vision4Press platform.
Data correspond to usage on the plateform after 2015. The current usage metrics is available 48-96 hours after online publication and is updated daily on week days.
Initial download of the metrics may take a while.