Fig. 1
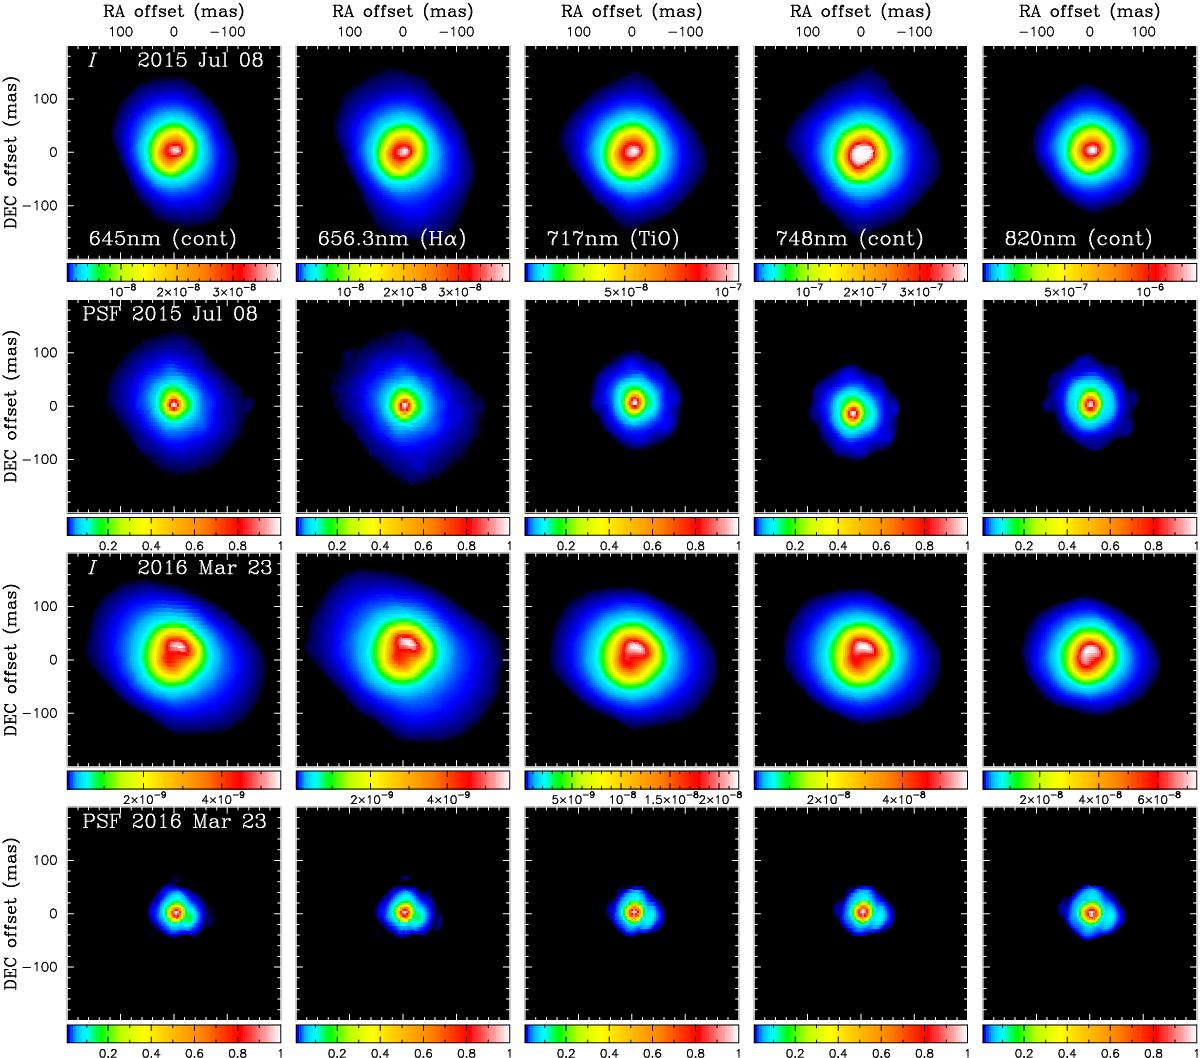
Intensity maps of W Hya observed with SPHERE-ZIMPOL. The first and third rows show the data of W Hya obtained on 2015 July 8 (phase 0.92, Paper I) and on 2016 March 23 (phase 0.54), respectively. The second and fourth rows show the intensity maps of the PSF reference star observed in 2015 and 2016, respectively. The observed images at 645 nm (CntHa, continuum), 656.3 nm (NHa, Hα), 717 nm (TiO717, TiO band), 748 nm (Cnt748, continuum), and 820 nm (Cnt820, continuum) are shown from the left to the right. North is up, east to the left in all panels. While the intensity peak is approximately at the center in 2015, the peak is clearly off-centered in 2016. The Strehl ratios for W Hya are comparable between 2015 and 2016, although those for the PSF references differ significantly between 2015 and 2016 (Sect. 3.1.1). The intensity maps of W Hya, which are flux-calibrated as described in Sect. 2.1, are shown in units of W m-2μm-1 arcsec-2. The color scale of the intensity maps is cut off at 1% of the intensity peak.
Current usage metrics show cumulative count of Article Views (full-text article views including HTML views, PDF and ePub downloads, according to the available data) and Abstracts Views on Vision4Press platform.
Data correspond to usage on the plateform after 2015. The current usage metrics is available 48-96 hours after online publication and is updated daily on week days.
Initial download of the metrics may take a while.