Fig. 9
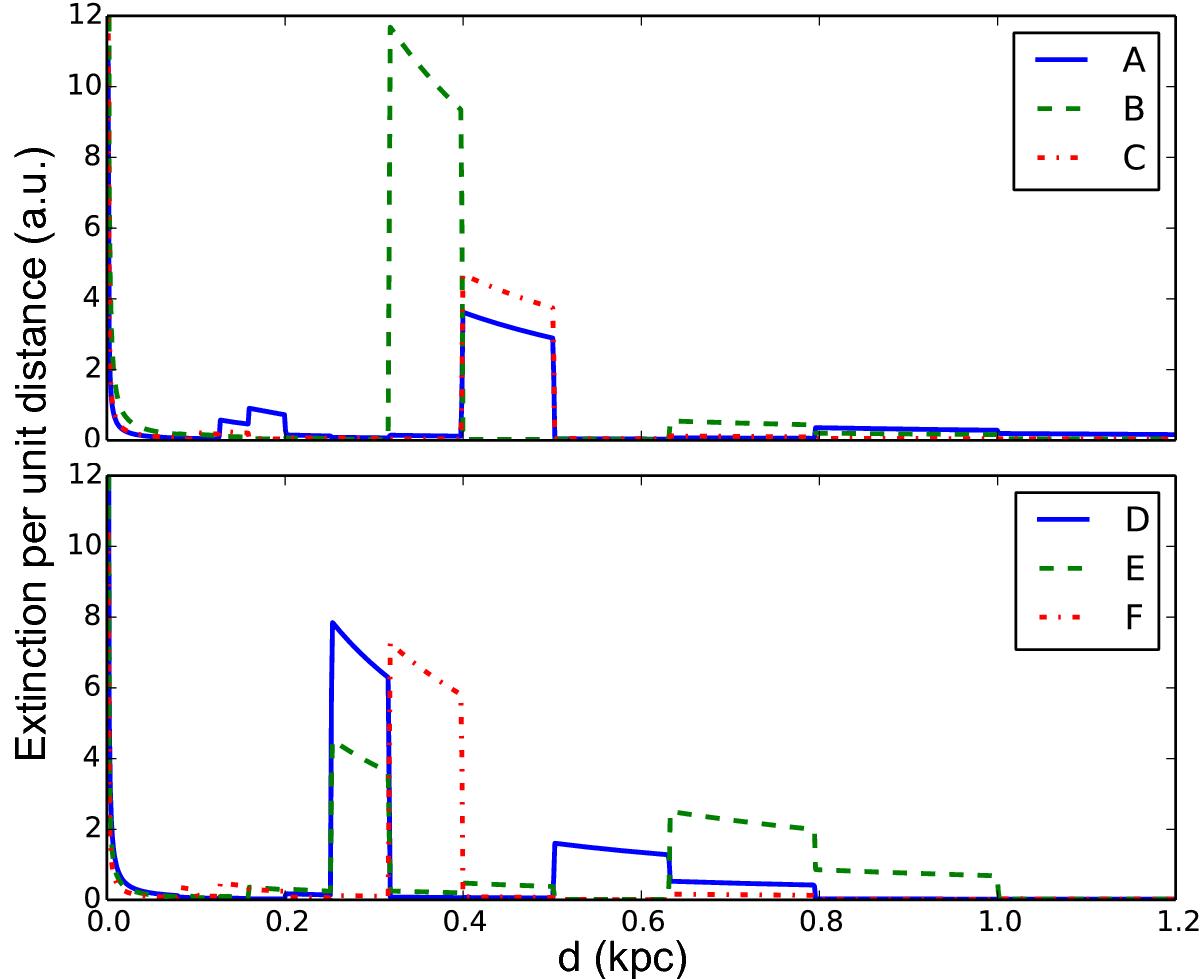
Profiles of the local reddening per unit distance for selected lines of sight in the IC 342 field, calculated from the Green et al. (2015) reddening model with MWDUST. The labels correspond to the lines of sight shown in Fig. 6. All six profiles show the presence of a dust cloud between 200 and 500 pc, and D and E show the presence of a second cloud between 500 and 800 pc.
Current usage metrics show cumulative count of Article Views (full-text article views including HTML views, PDF and ePub downloads, according to the available data) and Abstracts Views on Vision4Press platform.
Data correspond to usage on the plateform after 2015. The current usage metrics is available 48-96 hours after online publication and is updated daily on week days.
Initial download of the metrics may take a while.