Fig. 8
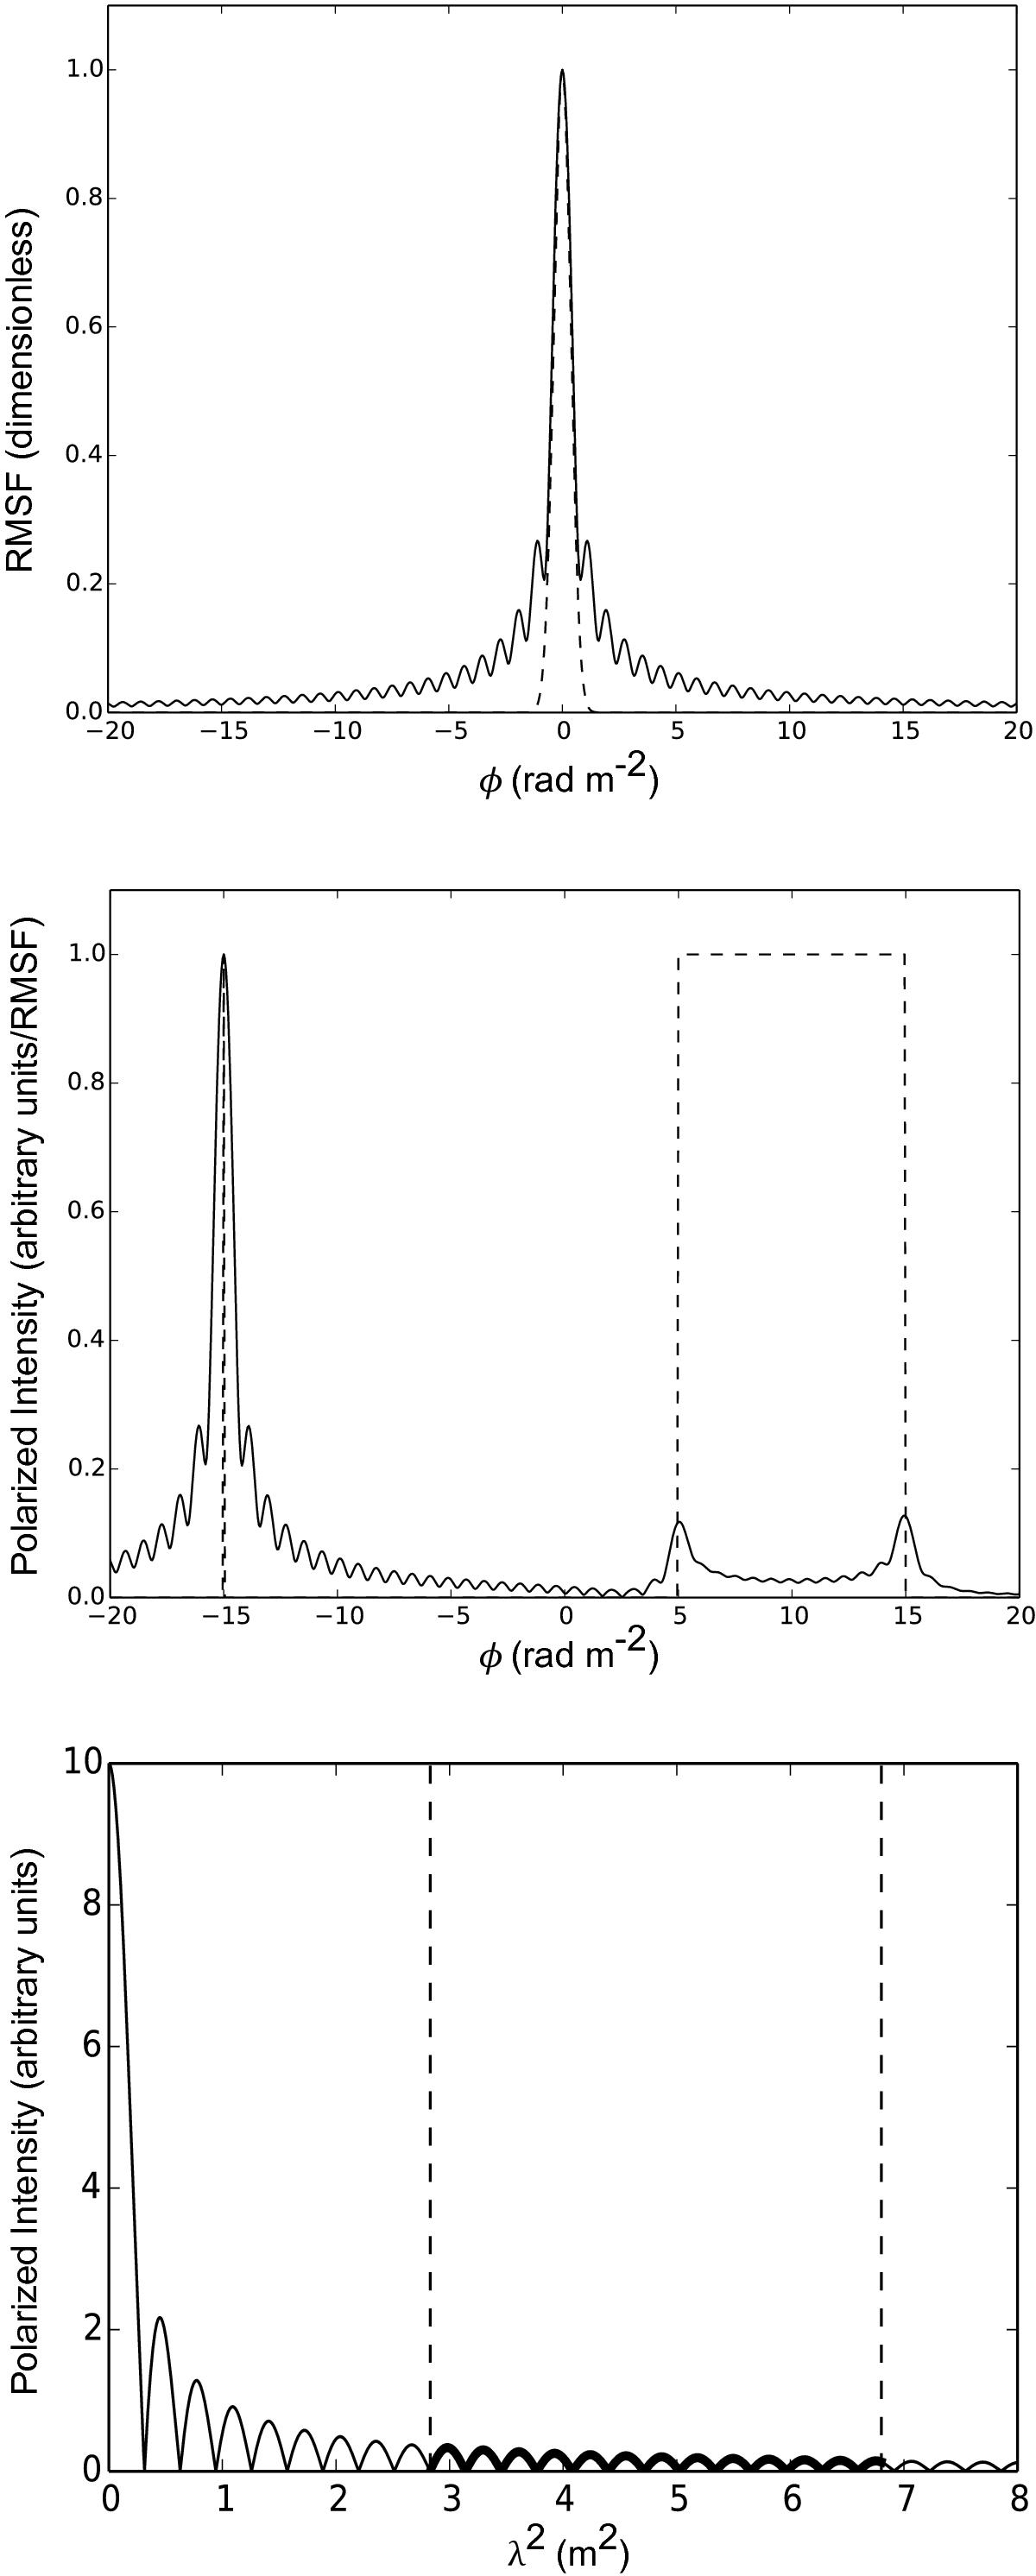
Top: solid line: the RMSF for the frequency sampling of the IC 342 observations. Dashed line: the Gaussian used as the restoring function in the RM CLEAN algorithm. Middle: dashed line: Input spectrum containing a delta function at φ = −15 rad m-2 and a Faraday slab between +5 and +15 rad m-2, both with amplitude of 1. Solid line: resulting spectrum using the frequency sampling of the IC 342 observations. The Faraday slab is almost completely depolarized. Bottom: the polarization as a function of λ2 for the Faraday slab above. The wavelength range of the LOFAR HBA is between the two dashed lines and the simulated signal in this range is marked in bold.
Current usage metrics show cumulative count of Article Views (full-text article views including HTML views, PDF and ePub downloads, according to the available data) and Abstracts Views on Vision4Press platform.
Data correspond to usage on the plateform after 2015. The current usage metrics is available 48-96 hours after online publication and is updated daily on week days.
Initial download of the metrics may take a while.