Fig. 7
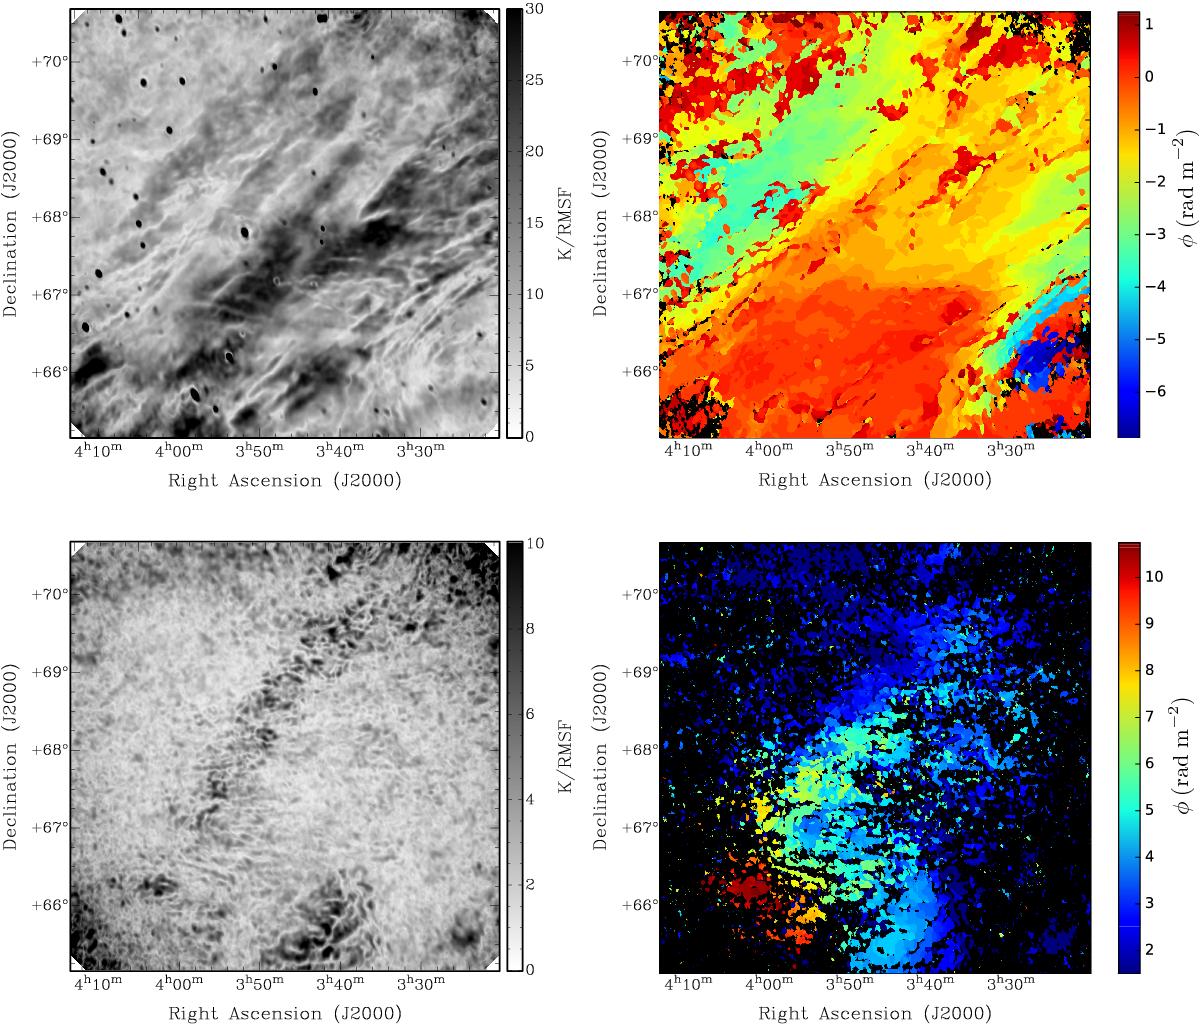
Left: maps of the peak polarized intensity in selected Faraday depth ranges. Right: maps of the Faraday depth of peak emission, for the same ranges in Faraday depth. Pixels with peak polarized intensity below 10 σQU are masked. Top panels: Faraday depths between −7 and +1.5 rad m-2. Bottom panels: Faraday depths between +1.5 and +11 rad m-2. The compact sources in the top panel are caused by the instrumental polarization.
Current usage metrics show cumulative count of Article Views (full-text article views including HTML views, PDF and ePub downloads, according to the available data) and Abstracts Views on Vision4Press platform.
Data correspond to usage on the plateform after 2015. The current usage metrics is available 48-96 hours after online publication and is updated daily on week days.
Initial download of the metrics may take a while.