Fig. 6
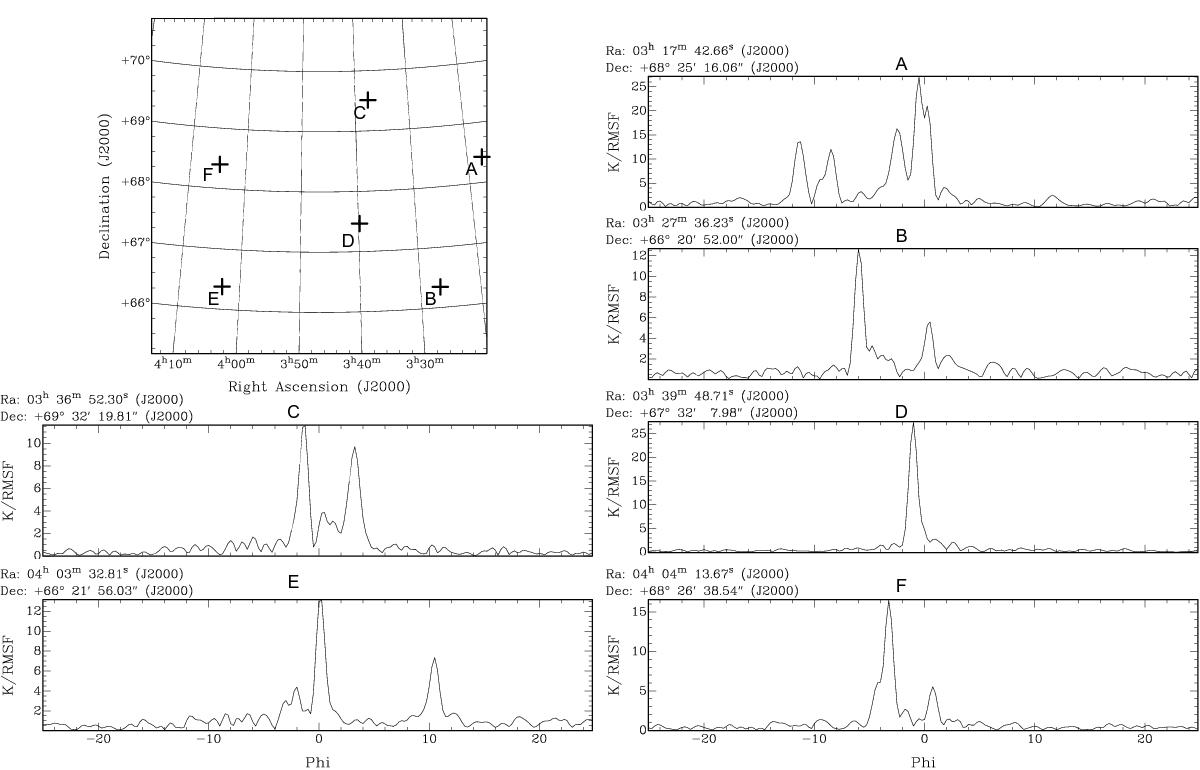
Faraday depth spectra for selected lines of sight. The top left panel shows the locations of the lines of sight. Panel A is at the location of the polarized emission from the giant radio galaxy WNB 0313+683, which shows two Faraday depth components at −11.4 and −8.6 rad m-2 (which overlap in angular position at this resolution), a Stokes I leakage feature at −0.5 rad m-2, and a diffuse emisison peak at −3 rad m-2. Other panels are at locations containing only diffuse emission, and show either one (D) or two (B, C, E, F) clear peaks.
Current usage metrics show cumulative count of Article Views (full-text article views including HTML views, PDF and ePub downloads, according to the available data) and Abstracts Views on Vision4Press platform.
Data correspond to usage on the plateform after 2015. The current usage metrics is available 48-96 hours after online publication and is updated daily on week days.
Initial download of the metrics may take a while.