Fig. 10
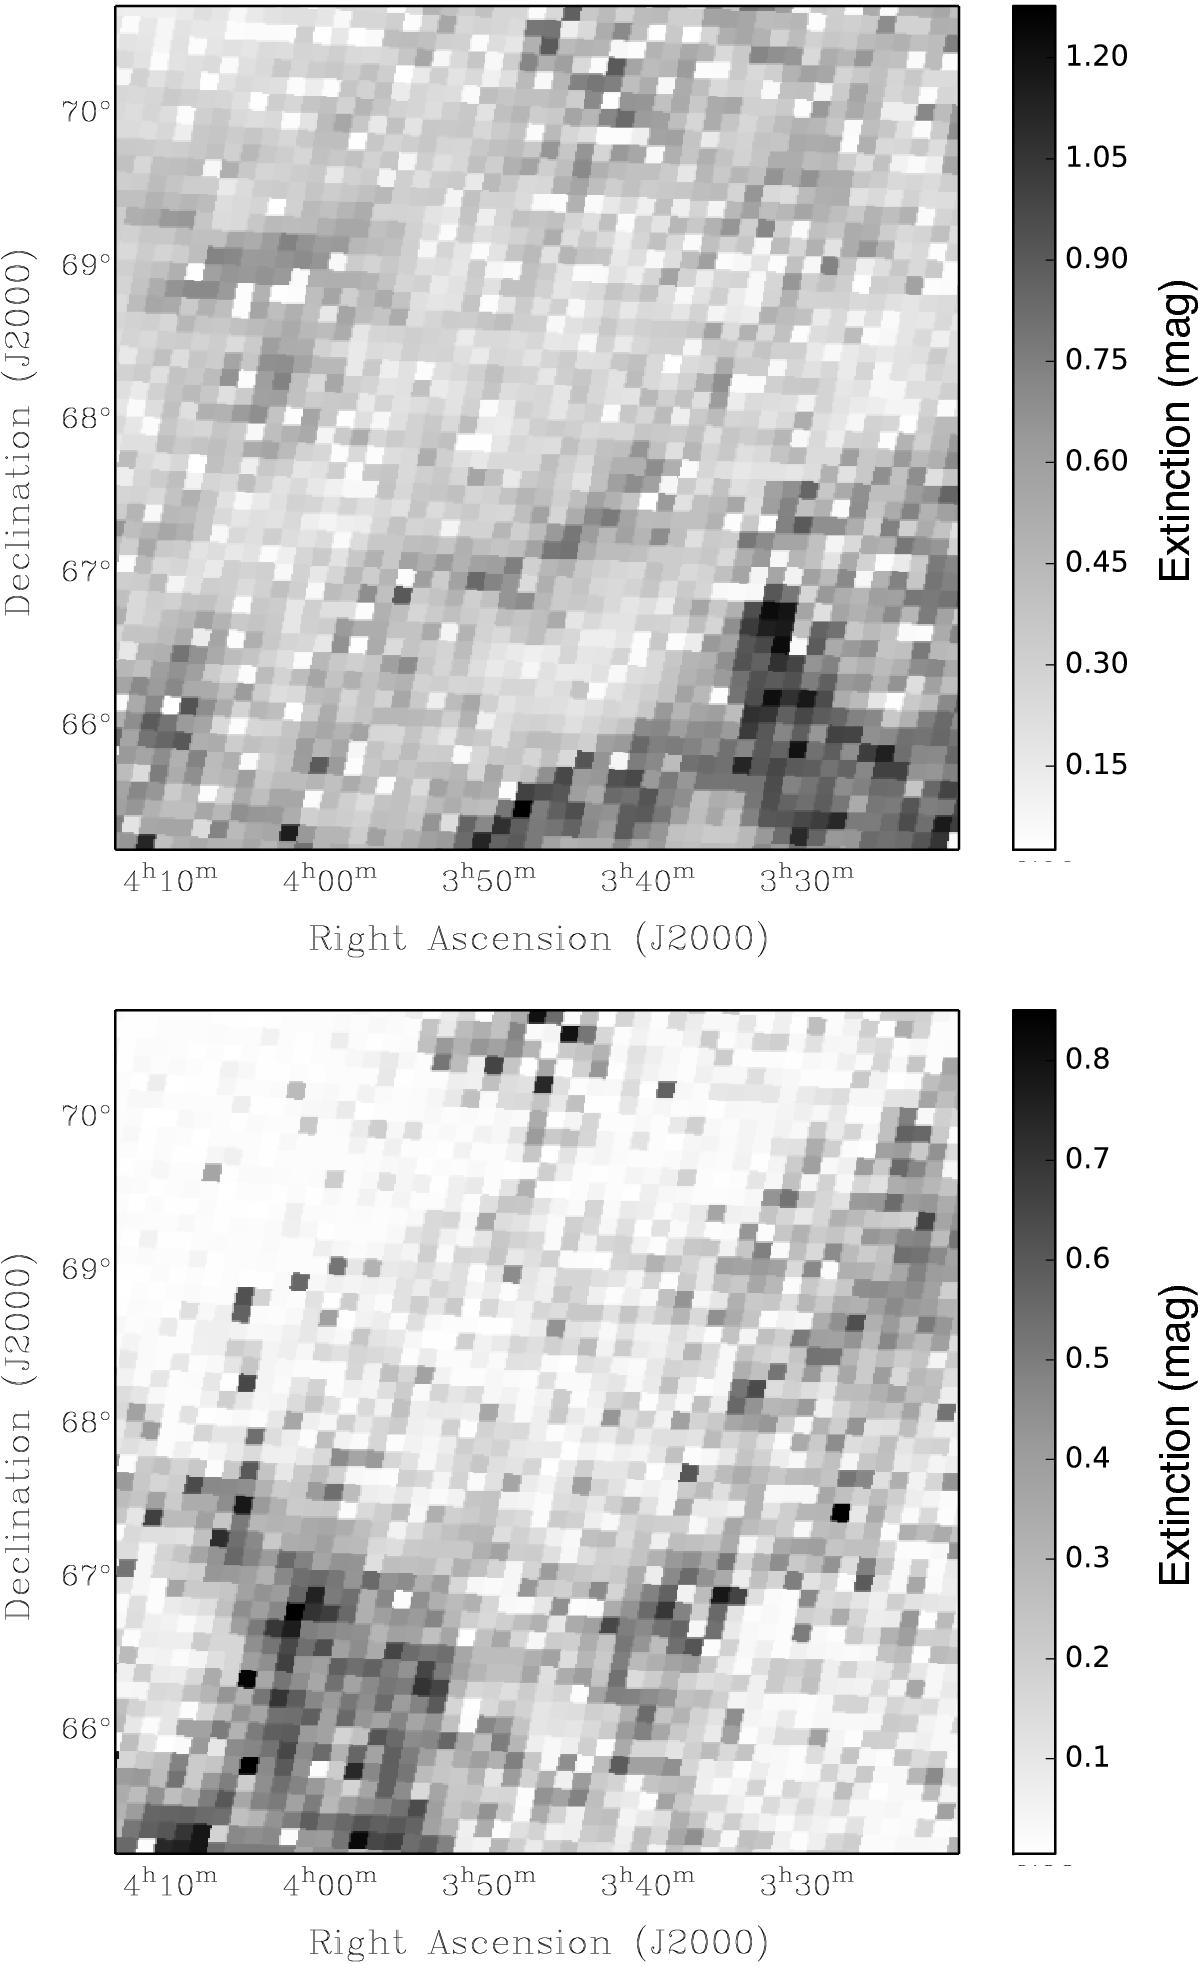
Maps of the reddening caused between 0 and 500 pc (top), and 500 and 1000 pc (bottom), calculated by integrating profiles from Fig. 9 over the selected distance range. The pixel size is set by the resolution of the Green et al. (2015) model. The top plot shows the presence of a field-filling dust cloud (assumed to be a neutral region) while the bottom shows the presence of a more distant cloud that occupies only part of the field.
Current usage metrics show cumulative count of Article Views (full-text article views including HTML views, PDF and ePub downloads, according to the available data) and Abstracts Views on Vision4Press platform.
Data correspond to usage on the plateform after 2015. The current usage metrics is available 48-96 hours after online publication and is updated daily on week days.
Initial download of the metrics may take a while.