Fig. 4
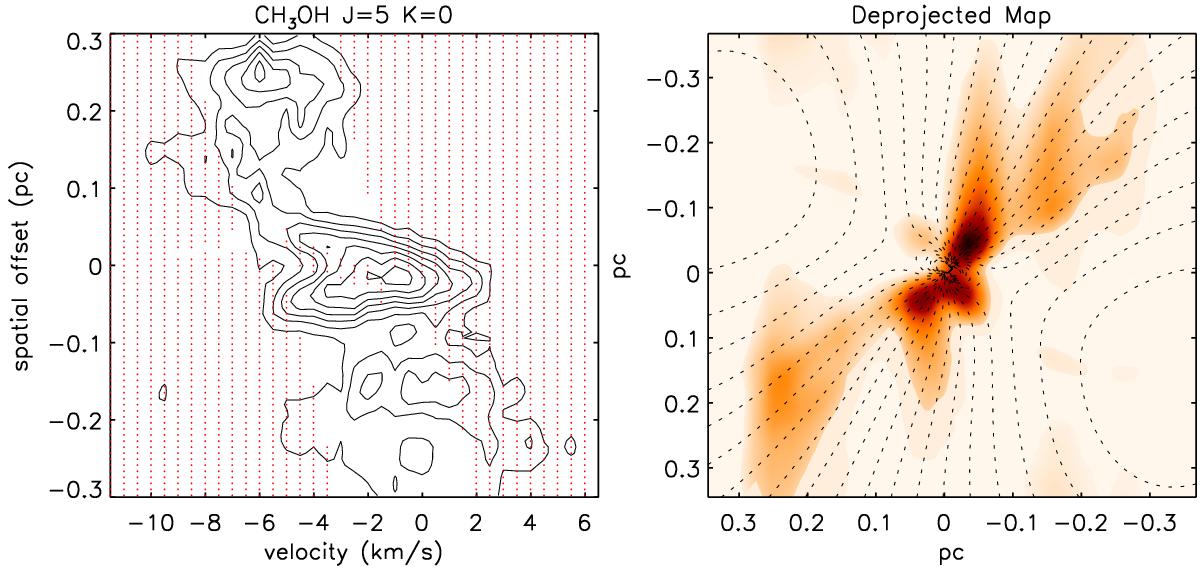
De-projection analysis of the PV diagram of the OB cluster forming region G10.6-0.4 (ψ = 25°). To perform the de-projection, we evaluated the absolute velocity field based on the enclosed mass. We adopt the value of centrally embedded stellar mass to be 175 M⊙ (Sollins & Ho 2005). The velocity vectors are twisted from pure rotational motions toward the center by 25°. Left: PV diagram of the CH3OH 50,5–40,4 E transition in G10.6-0.4 (see also Liu et al. 2011). Contour levels are 0.36 Jy beam-1× [1, 2, 3, 4, 5, 6, 7]. Regions in this PV diagram that cannot be explained with the velocity field model are masked with red dots. Right: 2 dimensional image of the de-projected structures. Dashed lines are the iso line-of-sight velocity contours, start from −5.0 km s-1, separated by ±0.5 km s-1. The de-projected image shows elongated large scale structure (≳0.5 pc) from bottom left to top right. More complicated structures are seen within the central ~0.15 pc radius.
Current usage metrics show cumulative count of Article Views (full-text article views including HTML views, PDF and ePub downloads, according to the available data) and Abstracts Views on Vision4Press platform.
Data correspond to usage on the plateform after 2015. The current usage metrics is available 48-96 hours after online publication and is updated daily on week days.
Initial download of the metrics may take a while.